Date: Fri, Dec 19 2025 | 12:15 PM GMT
The broader cryptocurrency market has been showing relative strength despite concerns around the Japan rate hike, while easing U.S. inflation has helped both Bitcoin (BTC) and Ethereum (ETH) remain in the green. Against this backdrop, Bitcoin Cash (BCH) has quietly moved into the spotlight, posting a notable upside move.
BCH has climbed nearly 9% recently, but the bigger story appears to be unfolding on the chart itself. Price action is now forming a structure that often precedes larger trend reversals, suggesting that the recent rally may be more than just a short-term bounce.
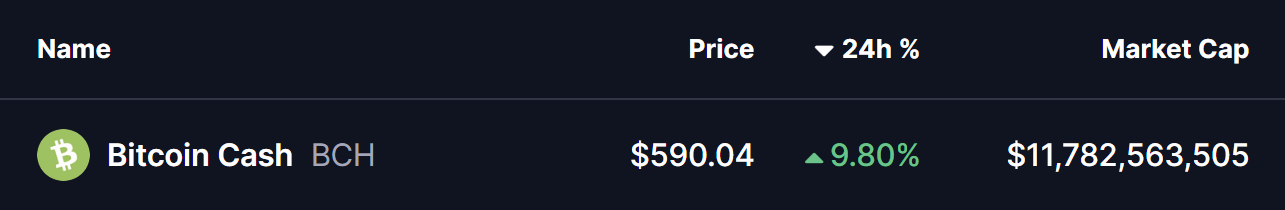
Source: Coinmarketcap
Rounding Bottom in Play?
On the daily timeframe, Bitcoin Cash appears to be carving out a rounding bottom formation — a classic bullish reversal pattern that reflects a gradual shift from distribution to accumulation. This pattern typically develops after a prolonged correction, as selling pressure fades and buyers slowly regain control.
The setup began after BCH faced a firm rejection near the $630 region in September 2025. That rejection triggered a sharp decline, dragging price down toward the $446.9 area. Importantly, sellers failed to push price significantly lower from there, and strong demand emerged at those levels. Over time, BCH stabilized, volatility compressed, and price began to curl higher, completing the rounded base structure.
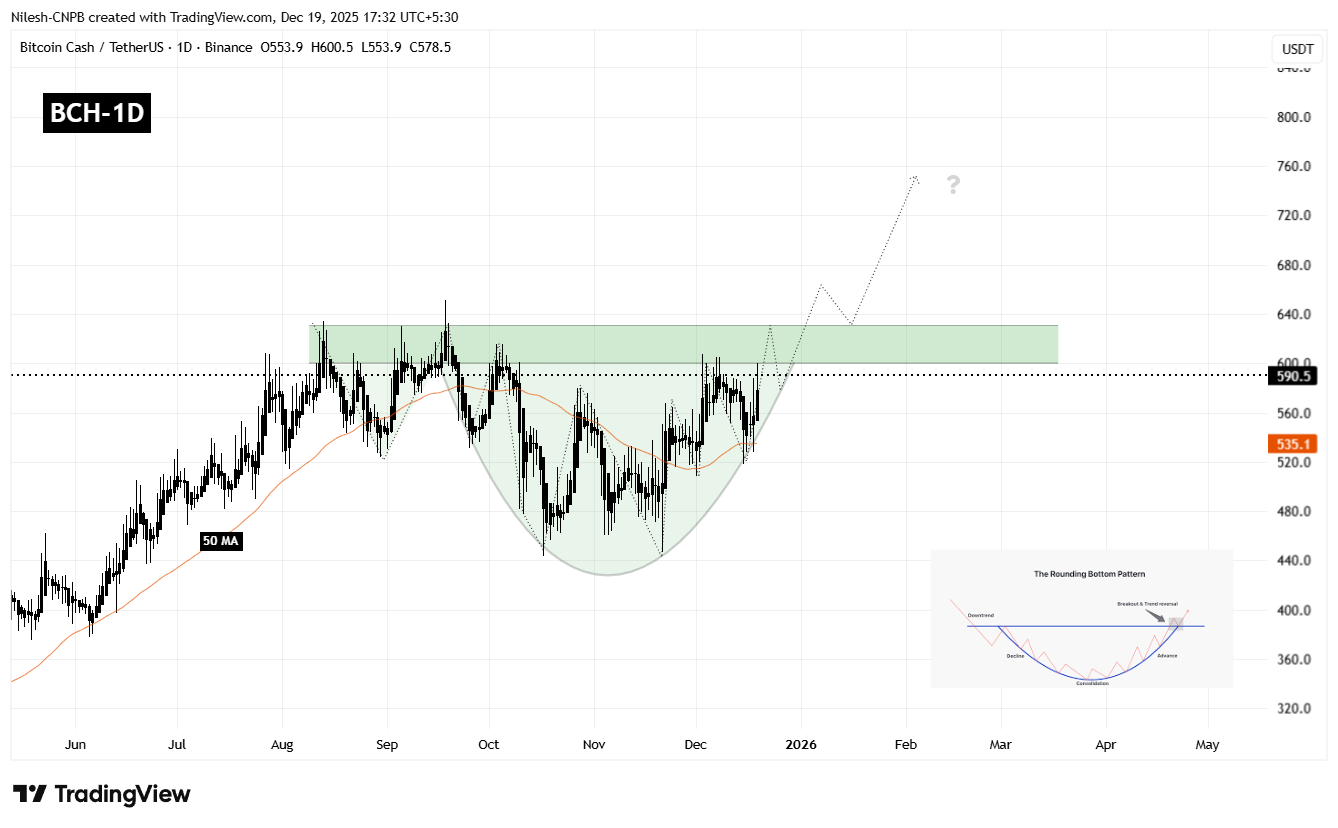
Bitcoin Cash (BCH) Daily Chart/Coinsprobe (Source: Tradingview)
Currently, BCH is trading around the $590 mark and pressing up against a well-defined resistance zone between $600 and $630. This area represents the neckline of the rounding bottom pattern and has capped price advances multiple times in the past, making it the most critical level to watch in the near term.
What’s Next for BCH?
A clean daily close above the $600–$630 resistance zone would confirm the bullish rounding bottom breakout. If that breakout is followed by a successful retest of the same zone as support, it would significantly strengthen the bullish case and suggest that a new upward leg is underway.
Based on the depth of the rounding structure, the projected upside target points toward the $800–$820 region. Reaching that zone would imply a potential upside of roughly 35–40% from current levels, aligning with the measured move typically associated with this pattern.
However, patience remains important. Before any confirmed breakout, BCH could still experience short-term pullbacks, including a dip toward the rising base of the rounding structure or the 50-day moving average, which has been acting as dynamic support during the recovery. Such pullbacks would not necessarily invalidate the bullish setup, as long as price continues to hold above the higher low structure.
Until a decisive breakout and retest occur, traders may want to remain cautious and avoid chasing price. The $600–$630 zone remains the line in the sand that will determine whether BCH transitions into a sustained bullish phase or remains range-bound for longer.
Disclaimer: The views and analysis presented in this article are for informational purposes only and reflect the author’s perspective, not financial advice. Technical patterns and indicators discussed are subject to market volatility and may or may not yield the anticipated results. Investors are advised to exercise caution, conduct independent research, and make decisions aligned with their individual risk tolerance.
Disclaimer: The information on this page may come from third parties and does not represent the views or opinions of Gate. The content displayed on this page is for reference only and does not constitute any financial, investment, or legal advice. Gate does not guarantee the accuracy or completeness of the information and shall not be liable for any losses arising from the use of this information. Virtual asset investments carry high risks and are subject to significant price volatility. You may lose all of your invested principal. Please fully understand the relevant risks and make prudent decisions based on your own financial situation and risk tolerance. For details, please refer to
Disclaimer.
Related Articles
Numerical Analysis of Asset Performance from 2026 to Present: Bitcoin Worst Performer, Crude Oil Best
Author: Coingecko
Compiled by: Felix, PANews
Following a turbulent end to 2025, Bitcoin continued to fluctuate downward in early 2026. Meanwhile, geopolitical and macroeconomic events have driven the rise in gold, silver, and recently crude oil prices. As cryptocurrencies continue to be adopted by the mainstream as an asset class, many Wall Street investors may be experiencing their first crypto bear market. Coingecko examined how cryptocurrencies performed relative to other traditional asset classes at the beginning of 2026.
With the outbreak of the Iran war, crude oil prices have surged faster than all other asset classes since early 2026.
Since the start of 2026, crude oil prices have been gradually increasing due to escalating tensions in the Middle East and critical shortages in market supply. However, as the United States and Israel launched operations on February 28,
PANews6m ago
Bernstein: 60% of Bitcoin Unmoved for Over a Year, Long-Term Holders Remain Steadfast
A Bernstein report shows that Bitcoin retail holders have recently engaged in panic selling, but long-term holders remain steadfast, with over 60% of Bitcoin unmoved for more than a year, demonstrating confidence in Bitcoin and its characteristics as a store of value.
GateNews7m ago
Michael Saylor's Strategy Trims Losses as Bitcoin Tops $74,000 - U.Today
Strategy Inc. has reduced its losses from Bitcoin's decline to $62,553 as the price rebounded to $74,000, improving its portfolio by 8.7%. Despite ongoing volatility, Michael Saylor remains optimistic about Bitcoin's recovery, aiming for a million BTC holdings.
UToday16m ago
Jane Street-affiliated address received 205.36 BTC over the past 2 hours
Gate News report: On March 16, according to Lookonchain monitoring, a Jane Street-associated address received 205.36 Bitcoin from a certain CEX within the past 2 hours, valued at approximately $15.08 million.
GateNews21m ago
Glassnode: BTC Options Market Shows Concentrated Negative Gamma Positions Near $75,000, Potentially Amplifying Upside Volatility
Gate News reported on March 16 that blockchain data analytics firm Glassnode stated on social media that the Bitcoin options market has a significant concentration of negative gamma positions around the $75,000 strike price. Data shows that market makers are widely holding structural call option short positions at this price level. Glassnode noted that when Bitcoin spot price approaches this region, hedging operations by market makers could intensify, potentially amplifying upward price volatility.
GateNews25m ago
If starting from 2018, buying one BTC deep out-of-the-money put option every month, can you make money long-term?
# Author: Michel Athayde, Bitget Wallet BD Ambassador
## Abstract
In traditional financial markets, long-term purchases of deep out-of-the-money (OTM) puts are often viewed as a classic "black swan insurance" strategy: consistently losing premium in normal times, but breaking even or making significant profits in a single event when extreme risks occur. The question is: does this logic still hold in the crypto market with higher volatility and more frequent crashes?
The backtesting results presented in this report provide a nuanced answer. Based on historical data from 2018-01-01 to 2026-03-14, we conducted an analysis of
PANews29m ago
