
Date: Sun, Dec 28, 2025 | 11:20 AM GMT
The broader cryptocurrency market is showing modest strength, with both Bitcoin (BTC) and Ethereum (ETH) trading in the green. This steady performance among major assets has helped stabilize overall market sentiment, creating room for select altcoins — including Worldcoin (WLD) — to develop constructive technical setups.
At the time of writing, WLD is trading with a modest intraday gain. More importantly, a notable whale accumulation combined with an improving lower-timeframe structure suggests that momentum may be shifting in favor of the bulls.
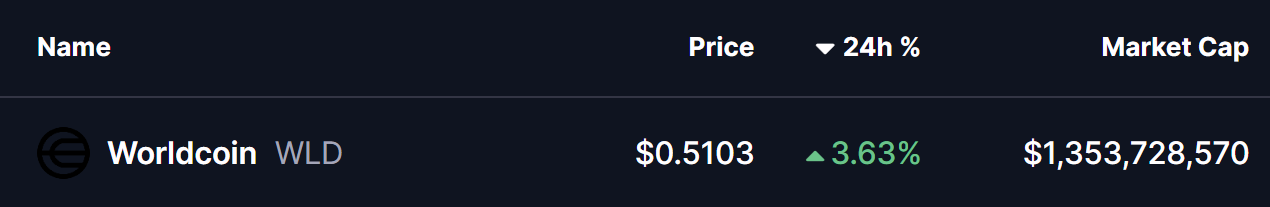
Source: Coinmarketcap
Major Accumulation
On-chain data has added an extra layer of confidence to WLD’s current setup. According to Lookonchain, on December 25, a wallet (0xf000) linked to Multicoin Capital spent $30 million USDC to acquire 60 million WLD at an average price of $0.50 through an OTC deal.
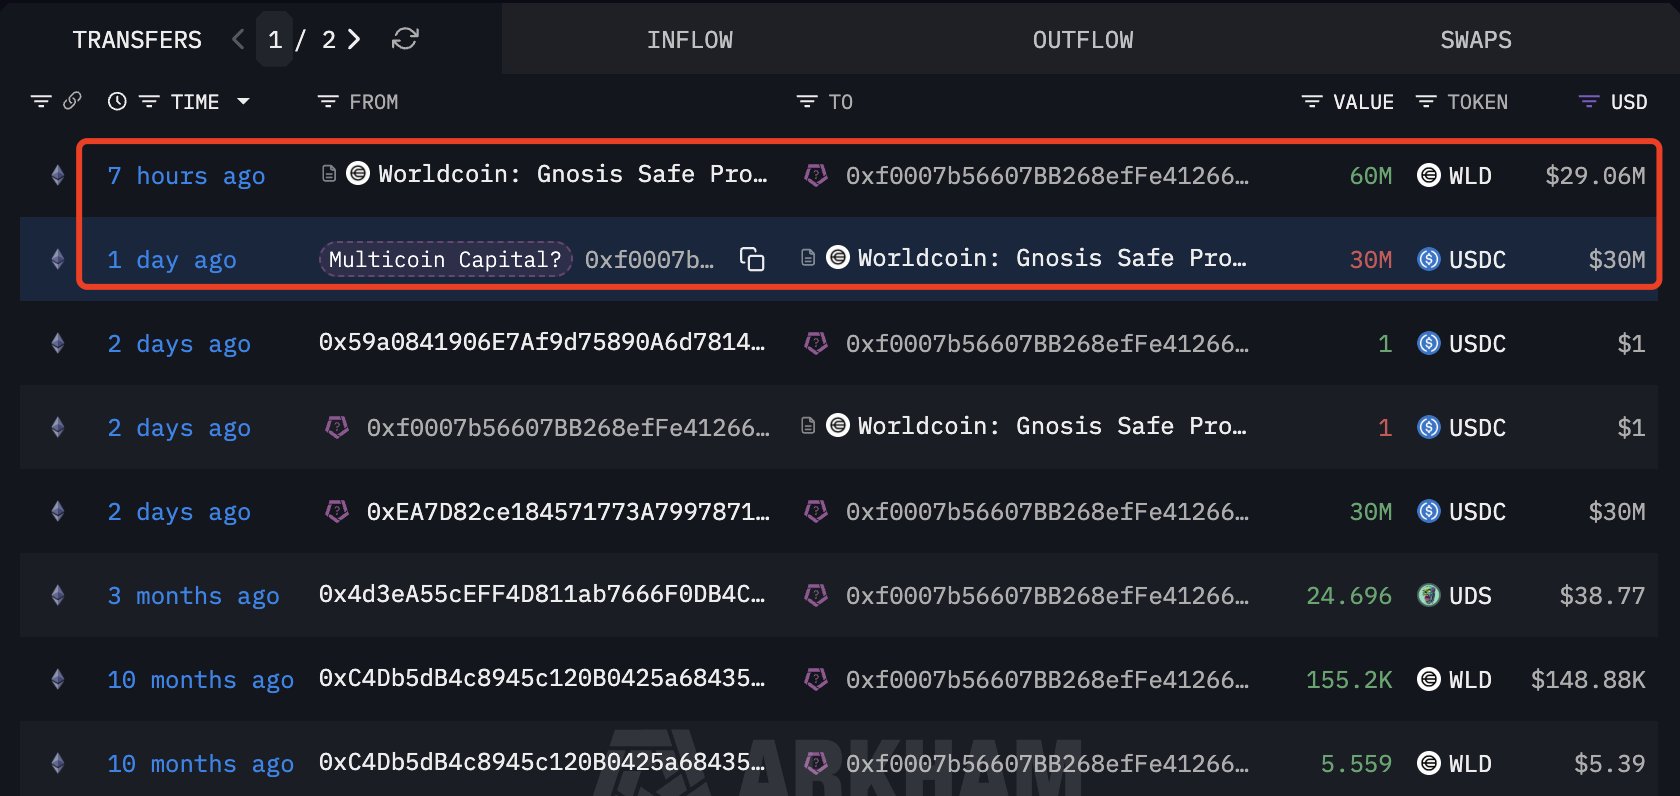
Source: @lookonchain (X)
Such large-scale accumulation near key support levels often signals long-term conviction rather than short-term speculation.
Adam and Eve Pattern in Play
On the 4-hour chart, WLD is forming a textbook Adam and Eve double bottom pattern — a bullish reversal structure that frequently marks the end of downtrends.
The pattern began after WLD faced rejection from the $0.5202–$0.5290 resistance zone. The initial decline was sharp and aggressive, forming the V-shaped “Adam” bottom near the $0.47 region. This was followed by a second, more rounded decline — the “Eve” portion — which bottomed at a similar price level, reinforcing strong demand in that zone.
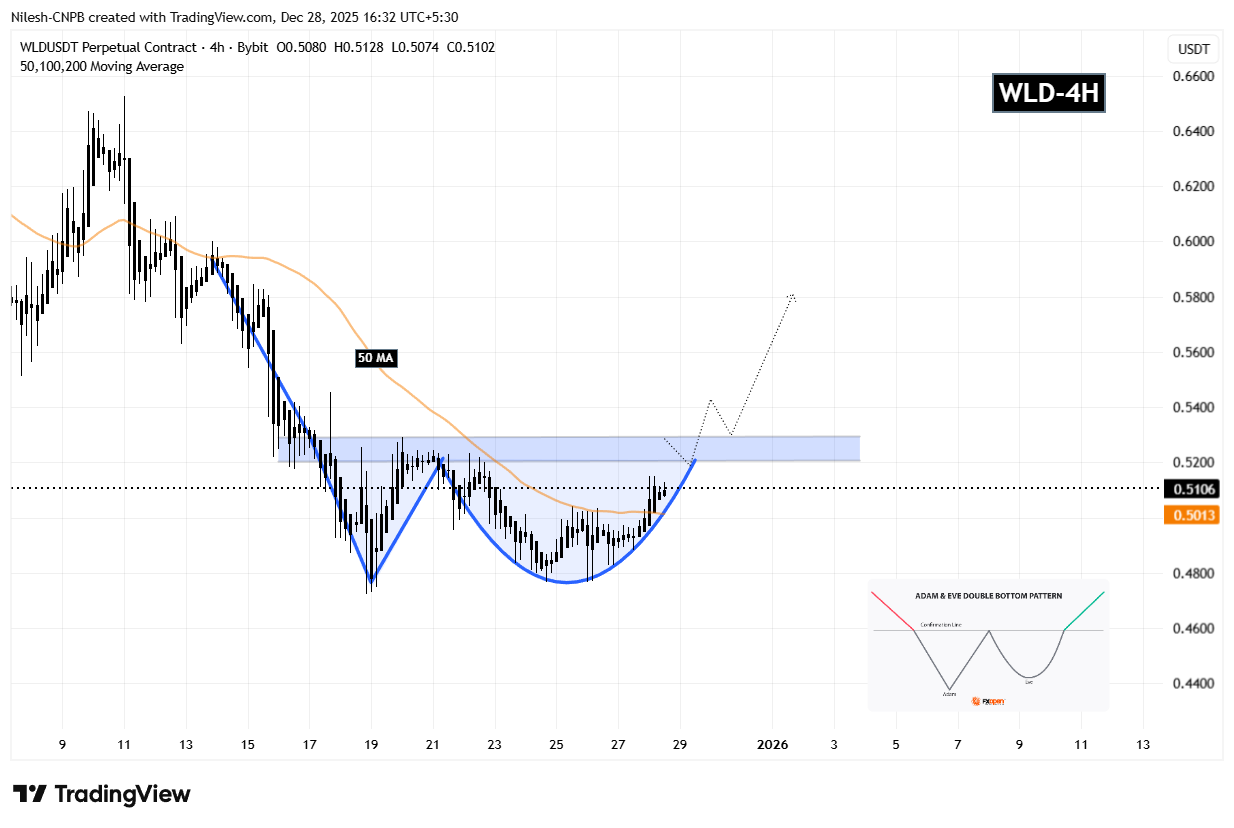
Worldcoin (WLD) 4H Chart/Coinsprobe (Source: Tradingview)
Since completing the second bottom, WLD has steadily pushed higher, reclaimed the 50-period moving average, and is now carving out the right side of the structure near $0.5106. Price is currently pressing against the neckline area, signaling that a decisive move may be approaching.
What Next for WLD?
If WLD continues to hold above the 50 MA support near $0.5013, the bullish structure remains intact. A clean breakout above the $0.5290 neckline, ideally followed by a successful retest, would confirm the Adam and Eve pattern.
Once confirmed, the projected measured move points toward the $0.58 region, suggesting a potential upside of roughly 13% from current levels. This aligns closely with the projected path shown on the chart and would mark a meaningful trend shift on the lower timeframe.
On the flip side, failure to hold the 50 MA could delay the breakout scenario and keep WLD range-bound in the near term. As long as that support holds, however, the technical bias remains tilted to the upside.
Disclaimer: The views and analysis presented in this article are for informational purposes only and reflect the author’s perspective, not financial advice. Technical patterns and indicators discussed are subject to market volatility and may or may not yield the anticipated results. Investors are advised to exercise caution, conduct independent research, and make decisions aligned with their individual risk tolerance.
About Author: Nilesh Hembade is the Founder and Lead Author of Coinsprobe, with over 5 years of experience in the cryptocurrency and blockchain industry. Since launching Coinsprobe in 2023, he has been providing daily, research-driven insights through in-depth market analysis, on-chain data, and technical research.

Disclaimer: The information on this page may come from third parties and does not represent the views or opinions of Gate. The content displayed on this page is for reference only and does not constitute any financial, investment, or legal advice. Gate does not guarantee the accuracy or completeness of the information and shall not be liable for any losses arising from the use of this information. Virtual asset investments carry high risks and are subject to significant price volatility. You may lose all of your invested principal. Please fully understand the relevant risks and make prudent decisions based on your own financial situation and risk tolerance. For details, please refer to
Disclaimer.
Related Articles
Polkadot’s AltRank Exploded to #1 While $DOT Price Stayed Down – The Signal Was There Weeks Ago
Something interesting has been happening with Polkadot, and most people probably missed it.
While the DOT price has been sitting relatively low compared to its all-time highs, another metric was quietly flashing a strong signal. AltRank, a metric from LunarCrush, jumped from 109 to 1 in just o
CaptainAltcoin35m ago
BTC Traditional Bottom Indicators Fail, Three New Indicators Gain Market Attention
Bitcoin's recent price volatility has been significant, falling from $76,000 to $69,200, with mixed signals from market bottom indicators. Newly focused indicators such as CVDD, NUPL, and stablecoin inflows may provide clearer insights into market dynamics, suggesting that the bottom has not yet been reached.
GateNews52m ago
BTC 15-minute surge of 0.53%: Dovish CPI signals trigger buying frenzy, whale accumulation intensifies supply compression
During the 2026-03-19 13:30-13:45 (UTC) time window, BTC recorded a 15-minute return of +0.53%, with the price moving slightly upward within the range of 69243.3 to 69826.0 USDT, with a volatility amplitude of 0.84%. The unexpected CPI data release combined with on-chain liquidity tightening sparked market attention, causing significant short-term price movements in BTC. Trading volume did not show extreme expansion, but spot buying pressure increased rapidly.
The main driver of this price movement was the official release of US March CPI data at 13:30 (UTC), which triggered a recovery in market risk appetite. C
GateNews53m ago
BTC Drops 0.50% in 15 Minutes: Whale Fund Outflows and Leveraged Short Positions Drive Downward Movement
During the period from 2026-03-19 12:45 to 2026-03-19 13:00 (UTC), BTC spot price fluctuated rapidly within the 69108.5 - 69664.4 USDT range, with a volatility amplitude of 0.80% and a return rate of -0.50%. Market attention increased, short-term volatility intensified significantly, and trading volume expanded accordingly, reflecting rising risk-aversion sentiment among investors during this window and increased active selling pressure.
The primary drivers of this volatility were whale address fund outflows on-chain and leverage position adjustments. Specifically, whale addresses experienced approximately 2,00
GateNews1h ago
XRP Price Could Resume Journey to New All-Time High if This Key Level Holds
XRP price pulled back after a recent move toward $1.60, yet the bigger structure still points to a larger trend that has not broken. Price now trades near $1.46, and that places it inside a zone that could decide whether the next leg higher begins or stalls again.
Crypto analysis platform
CaptainAltcoin1h ago
