The Support and Resistance Lines (SRL) is an AI-powered market analysis tool based on the BOLL20 line, designed to help you quickly identify support and resistance levels during price movements, assisting in trading decisions.
Feature Introduction
- Support Line: The price level where buying power may support the price during a downtrend.
- Resistance Line: The price level where selling pressure may resist the price during an uptrend.
- Applicable Scenarios: By combining support and resistance lines, you can estimate the potential price range, and set take-profit and stop-loss conditions or optimize your trading strategies.
How to Enable the SRL Indicator on the App
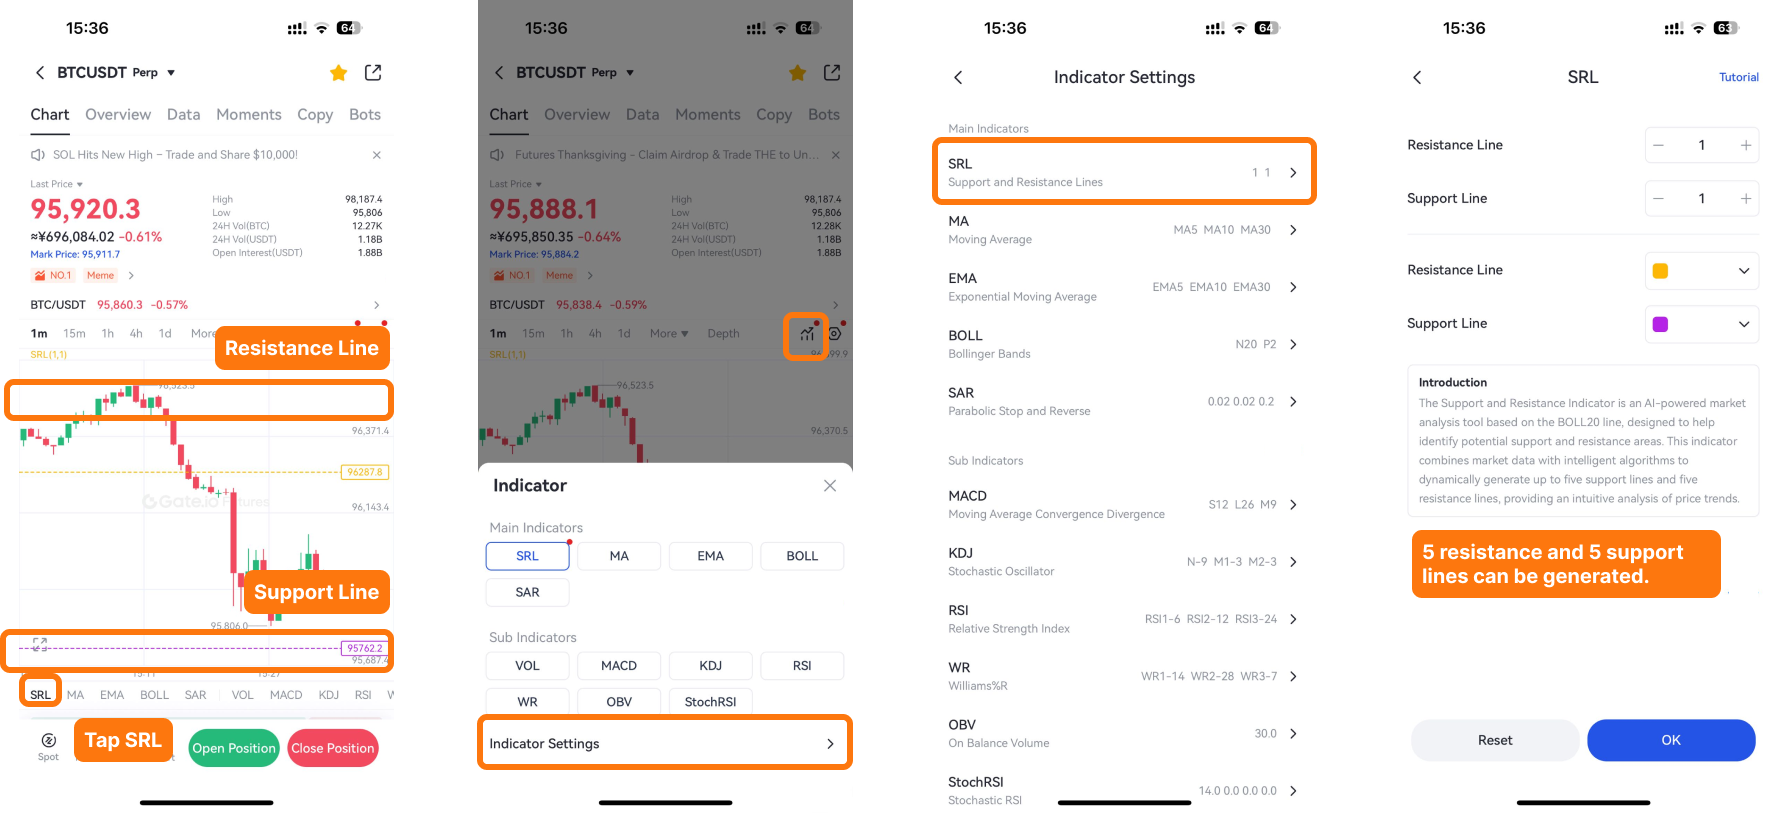
You can set up to 5 support lines and 5 resistance lines. The system will automatically calculate and generate them based on the algorithm.
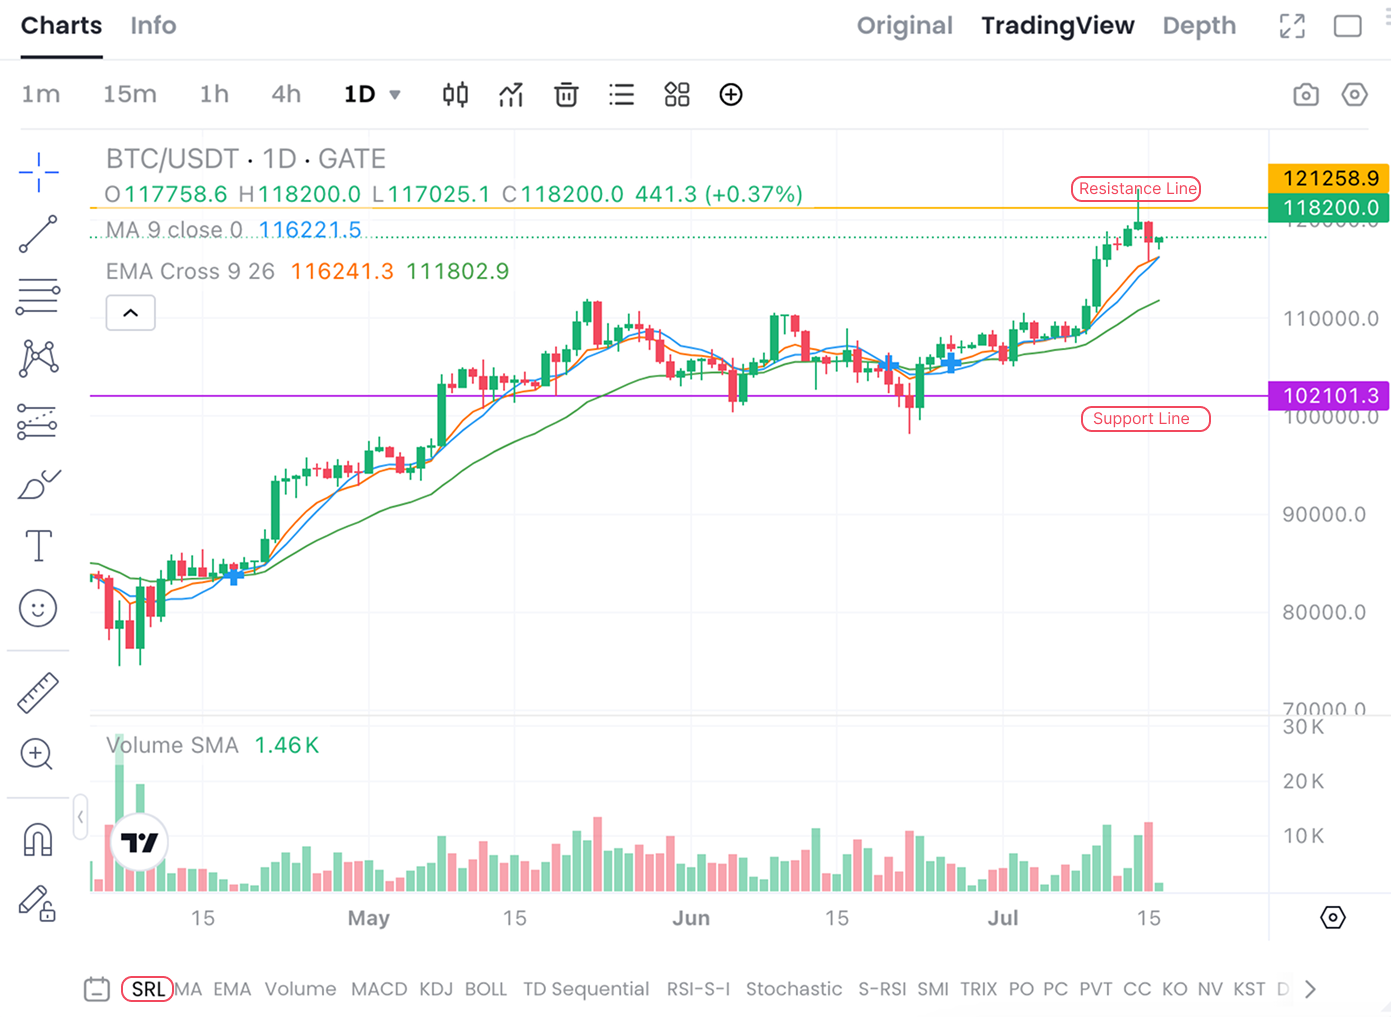
How to Enable the SRL Indicator on the Web
TradingView:
Original:
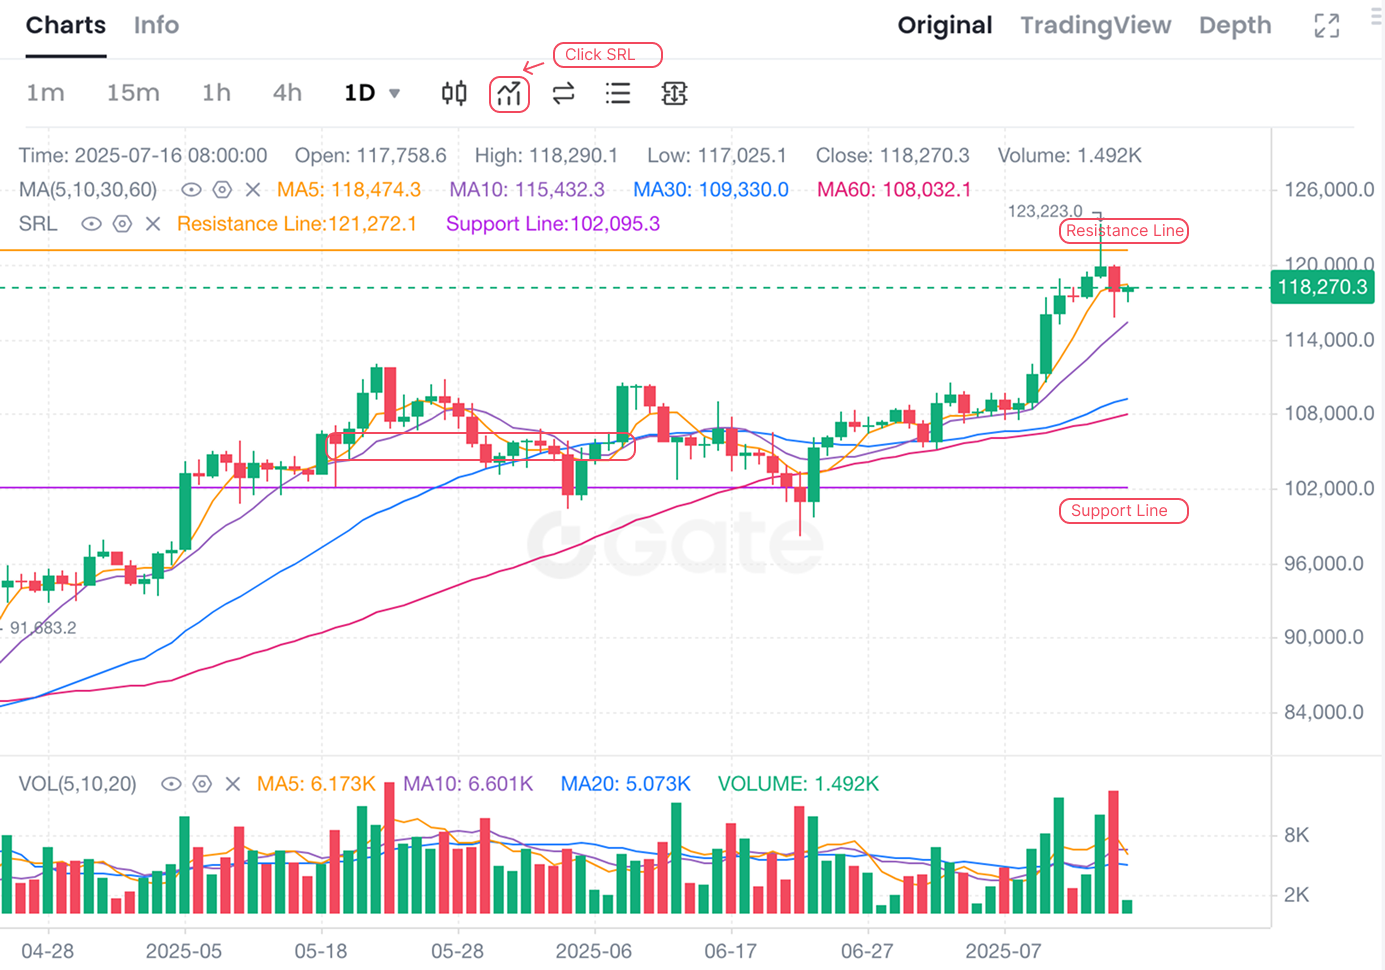
Note: Currently, only one support line and one resistance line can be set on the Web.
How to Interpret the SRL Display
- Support Line:
- Displayed below the current price.
- The closer it is to the current price, the stronger the support.
- Resistance Line:
- Displayed above the current price.
- The closer it is to the current price, the stronger the resistance.
Practical Examples
Example 1: Determining Price Range
- Scenario: The current price of BTCUSDT is 90,000 USDT.
- SRL Display:
- Support Lines: 88,000, 87,000, 85,000.
- Resistance Lines: 102,000, 103,000, 105,000.
- Usage:
- When the price approaches 88,000, consider buying.
- When the price approaches 102,000, consider selling or observing for a breakout.
Example 2: Setting Take-Profit and Stop-Loss (TP/SL)
- Scenario: A user opens a long position at 90,000 USDT.
- Setting Method:
- Set an SL price below the nearest support line, such as 83,500 USDT.
- Set a TP price above the nearest resistance line, such as 97,500 USDT.
Notes
- Adaptive Adjustment
The SRL will update in real-time based on market price fluctuations and trading volume. Please stay updated with the latest support and resistance levels. - Algorithm Limitation
Due to the algorithm's rules, the system may not generate enough support or resistance lines when there is insufficient data. - Assistance for Decision-Making
The SRL is an auxiliary tool which should be used in conjunction with other technical indicators (such as RSI, MACD) and market information for comprehensive analysis.
FAQ
- Why are there fewer than 5 support or resistance lines?
In certain market conditions, the algorithm may not generate enough valid support or resistance levels. This is a normal occurrence. - Why does the SRL deviate from the actual price?
The SRL is based on historical data and algorithmic calculations, so it may lag in fast-moving markets. - Can the algorithm parameters be adjusted?
The SRL parameters are optimized by the system, and user customization is not currently supported.
Through the SRL indicator, you can more efficiently analyze market trends, optimize trading strategies, and capture more investment opportunities!
Gate reserves the final right to interpret the product.
For further assistance, please visit the Gate official support page or contact our customer support team.
Disclaimer
The content provided herein is for reference and educational purposes only and does not constitute any financial, investment, trading, or legal advice, nor does it constitute an offer or solicitation to buy or sell any digital assets. Gate makes no express or implied representations or warranties regarding the accuracy, completeness, or timeliness of the information contained herein. Product features, interfaces, rules, and fee structures may be updated or adjusted at any time. Please refer to the latest announcements and the actual information displayed on the Gate platform for the most accurate details.
Digital asset investments involve significant risk, and prices may fluctuate substantially. You may lose the entire amount of your investment. Please make decisions cautiously based on your own financial situation and risk tolerance after fully understanding the associated risks. If necessary, you are advised to consult an independent professional financial or legal advisor.
For more information about potential risks, please refer to Gate's Risk Disclosure and User Agreement.
