What Is a Crypto Market Indicator? Definition, Types, and How to Use Them to Analyze Trends
When we speak of indicators, the first thing that comes to most minds is those tools based on mathematical calculations that appear on a trading chart and assist traders in making financial decisions. Most don’t know that indicators don’t always refer to technical indicators. Another form of indicator still relevant to traders, be it stock or crypto, is market indicators.
What is a Crypto Market Indicator?
A crypto market indicator can be described as a tool used to analyze the price action or volume of a cryptocurrency. The purpose of an indicator is to help traders identify and predict price trends, momentum, or even token volatility in the market. By using these tools, traders can better grasp the market and make more informed decisions about buying, selling, or holding a coin.
Crypto market indicators are mathematical calculations that consider data on a coin’s price history, volume, and open interest in that coin or the market as a whole. In the modern trading world, crypto market indicators are often represented as lines, curves, bars, or even candles on a trading chart. Visual representations of the figures or values calculated help traders get a single glance at possible upcoming price trends.
However, no market indicator is 100% accurate at all times. The cryptocurrency market is a fast-paced space that features tokens and assets with high volatility. As such, relying too heavily on market indicators is not advised. The best way to view the indicators is as valuable tools that can be incorporated into trading methods based on fundamental analysis or market sentiment to create a comprehensive trading strategy.
History of Market Indicators
The history of market indicators is, in truth, woven deeply into the history and evolution of commerce itself. With market indicators and stock market indices, the starting point is the late 19th century, with the Dow Jones Industrial Average (DJIA), developed to track 12 major industrial stocks.
Before the development of the DJIA index, investors and traders merely recorded and tracked the prices of stocks across the various stock exchanges manually. Some of these investors or brokers made their own informal price averages and indices based on a select group of stocks. However, in the 19th century, organizations based on trading and closely related to the stock exchange came up, and from one of those formalized gatherings came more formalized and better-developed methods of tracking the market. Charles Henry Dow, along with Edward Jones and Charles Bergtresser, founded Dow Jones & Company to track stock prices. They later developed and introduced their own DJA index that tracked the performance of 12 stocks.
Eventually, the index was renamed to DJIA and expanded to include 12 major industrial stocks. The DJIA stock index became a major benchmark for the stock market and was quickly followed by other stock indexes like the S&P 500 index developed by Standard & Poor and then the first index fund, the Vanguard 500 Index Fund.
Classifications of Market Indicators
Market indicators are quantitative tools that give traders information about the condition of the market, which they can use to make predictions about future market trends. These quantitative tools are all based on mathematical models and formulas, but these formulas differ across the different types of indicators. Market Indicators can be classified under these heads:
1. Trend Indicators
A market trend refers to the price direction of an asset or the market over a given period. A trend indicator is a tool that allows traders to examine the strength of a particular market trend, allowing them to make better predictions on the direction the market moves. Some common trend indicators include
Moving Averages
The moving average indicator is a technical analysis-based tool that can analyze the trends of individual stocks and the larger market. The moving average is presented as a single line on the trading chart, and the direction in which it moves provides hints related to the price trend.
When the line is straight, it often signals that the price trend is varied and relatively stable. Where it is angled upwards, it signals upcoming upward trends, and when pointed downwards, it exposes a negative trendline.

Source: Gate.com
The moving average indicator has different periods; the most commonly used include 15, 20, 30, 50, 100, and 200. For traders who want to decide on the broader market, the 50, 100, and 200 time periods are best suited.
The moving average is trusted in crypto and stock markets, and many variants exist. Examples include the Simple Moving Average (SMA), Exponential Moving Average (EMA), Mesa Adaptive Moving Average (MEMA), and Moving Average Convergence Divergence (MACD).
Ichimoku Cloud
This technical indicator provides a general picture of the market trend. The Ichimoku cloud indicator is a cloud on the price chart that defines support and resistance levels while providing possible trading signals.

Source: investopedia
The Ichimoku cloud collects multiple averages, which are then plotted on a trading chart in the form of a cloud. The tool is fairly complex and has multiple components. It is represented by five other moving averages: Tenkan Sen, Kijun Sen, Senkou Span A, Senkou Span B, and Chikou Span. The Ichimoku cloud is composed of all five lines and ordinarily shows up as red in a downward trend and green in an upward trend.
Parabolic SAR
The parabolic SAR is a typical trend indicator that helps traders predict asset price directions. The most popular method in which the indicator is used is to identify exit and entry points. Also known as the stop and reversal system, the Parabolic SAR shows up on the trading chart as a series of dots that appear either below or above the price line, depending on the trend direction. Where the trend signal is bullish, the dot is placed above, and where it is bearish, it is placed above the price line.
Source: Gate.com
2. Momentum Indicators
A momentum indicator measures how fast the price of an asset changes rather than the price rate itself. They show when the asset is overbought and oversold, which can, in turn, point to a possible trend reversal.
Relative Strength Index (RSI)
Also known as the relative strength index (RSI), the RSI is an oscillating technical analysis tool that tracks how fast the price of an asset changes over a trading period (usually 14 days). The RSI fluctuates between 0 and 100. An RSI value of 70 means the token is overbought, and there is the potential for a downward trend reversal. If it is below 30, it could mean that the asset is oversold, and there is a possible upward trend reversal.

Source: strike.money
Stochastic Oscillator
This is another technical analysis momentum indicator that covers the price data of a coin over a specific period. Like the RSI, the scale of the stochastic oscillator starts at 0 and ends at 100. The most common levels are between 20 and 80, readings above the latter showing an overbought market trend and below 20 indicating an oversold market.
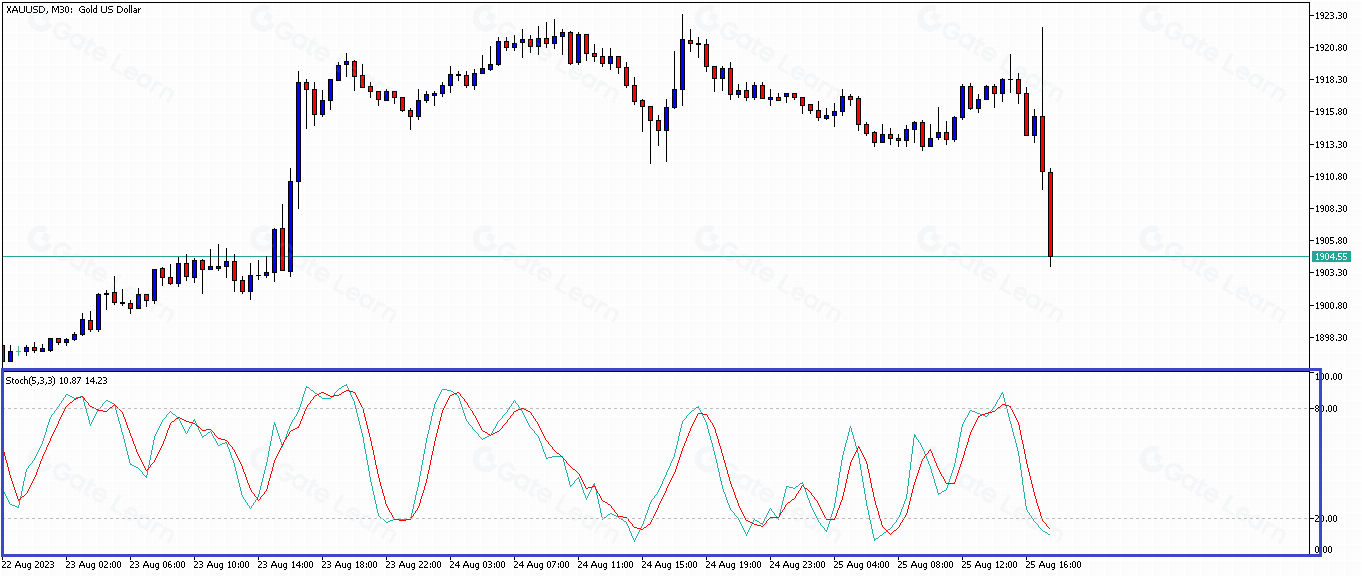
Source: Gate.com
3. Volume Indicators
Like the name suggests volume indicators allow traders to make predictions based on the volume action of a specific coin. By analyzing the volume of a coin or a market as a whole in comparison to its price action, traders can identify whether a trend is strong or weak and tell how long the trend is likely to last.
Ease of Movement
The Ease of Movement (EOM) indicator is a unique tool that uses data on the price and volume of a coin to determine the momentum of the price changes. It’s like a speedometer for the market that shows how easily or quickly the price of a coin moves up or down. The EOM oscillates around a zero line, with positive values indicating that upward price movements are happening with relatively high volume, suggesting strength in the trend. Conversely, negative EOM values suggest that the price of the coin is moving downwards more easily or quickly. Considering both price and volume, the EOM provides valuable insights into the force behind market trends, helping traders identify potential breakouts or reversals.

Source: investopedia
On Balance Volume (OBV)
On-Balance Volume (OBV) is a momentum-based indicator that tracks changes in trading volume to predict price movements. It’s like a running tally of volume, where rising prices increase the OBV, and falling prices decrease it. This creates a wholesome picture of buying and selling pressure, revealing whether volume flows into or out of a coin. By analyzing these trends, traders can anticipate potential trend breakouts or reversals. Where there is a divergence between the price and volume trends considered by the tool, it can signal an impending shift in the trend direction.

Source: corporatefinanceinstitute
The OBV works like a leading indicator, suggesting that changes in volume precede changes in price. It helps traders identify accumulation (rising OBV with rising prices) and distribution (falling OBV with falling prices) phases, providing valuable insights into the underlying strength of a trend. Using the OBV with other market indicators helps to provide a wider and more comprehensive understanding of the crypto market and to consequently make better trades.
4. Volatility Indicator
Volatility is a key concept in trading, especially in the crypto market, as it represents the degree of price fluctuation. High volatility means large and rapid price swings, while low volatility indicates smaller, less frequent price changes. Volatility indicators help traders analyze these price fluctuations to make better trading decisions.
Bollinger Bands
Bollinger Bands consist of a middle line and two outer bands. The middle line is an indicator on its own, in the sense that it is a moving price average. While the outer bands are calculated based on the price volatility. When the bands are thin it could mean low volatility, and when they are wide, it shows high volatility.

Average True Range (ATR)
The Average True Range (ATR) is a technical indicator that measures market volatility. It is typically calculated as a 14-day moving average of an asset’s price range.
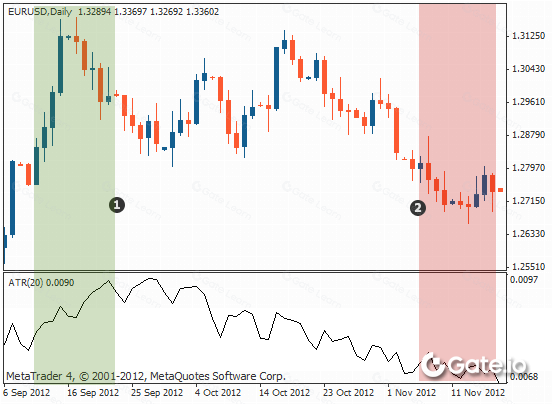
Source: Gate.com
The true range is the highest value out of the following calculations:
Current High - Current Low
Current Low - Previous Closing Price
Current low - Previous close
Keltner Channels
Keltner Channels are a volatility-based technical indicator composed of three lines: a central moving average line plus upper and lower bands that are set a distance away from that center line. The width of the bands is based on the volatility of the underlying asset’s price. They are similar to Bollinger Bands, but Keltner Channels use the average true range (ATR) to calculate the bands, while Bollinger Bands use the standard deviation.

How to Analyze Crypto Trends with Market Indicators
Cryptocurrency trading involves using technical indicators to analyze and identify potential trading opportunities and make informed decisions. These tools highlight market trends, momentum, volatility, and support/resistance levels.
Traders often use a combination of indicators to confirm signals and improve their chances of success. For example, a trader might use a moving average crossover to identify a potential trend change and then confirm the signal with a momentum indicator like the RSI or the Moving Average Convergence Divergence. Additionally, traders may use volatility indicators like Keltner Channels or the Average True Range (ATR) to gauge the potential risk and set appropriate stop-loss orders.
Using market indicators to analyze trends involves identifying the type of trend and its strength, that is, whether or not there is the potential for a reversal. Indicators can help traders visualize trends, confirm their existence, and identify potential trend reversals.
Conclusion
Crypto market indicators are valuable tools that can help traders have a complete look at the market trends, momentum, volatility, and volume of specific assets. However, it is important to note that no indicator is absolutely accurate, so it cannot serve as a sole foundation for making trading decisions. A good trading strategy merges market indicators with fundamental analysis or market sentiment.
Share
Content


Related Articles

Exploring 8 Major DEX Aggregators: Engines Driving Efficiency and Liquidity in the Crypto Market

What Is Copy Trading And How To Use It?

How to Do Your Own Research (DYOR)?

What Is Technical Analysis?

What Is Fundamental Analysis?