On March 24, Pi Network (PI) traded near $0.188, but the total increase for the month still reached 11.6%. The hidden bullish divergence in the Relative Strength Index (RSI) indicates weakening selling pressure, and the cup-and-handle pattern suggests that a breakout above the neckline at $0.204 could lead to approximately 22% upside. However, the Pi Isolation and Shock Index (PISI) reading is close to zero, indicating that PI currently lacks independent upward momentum.
Two Major Bullish Patterns Forming Simultaneously: RSI Divergence and Cup-and-Handle Structure
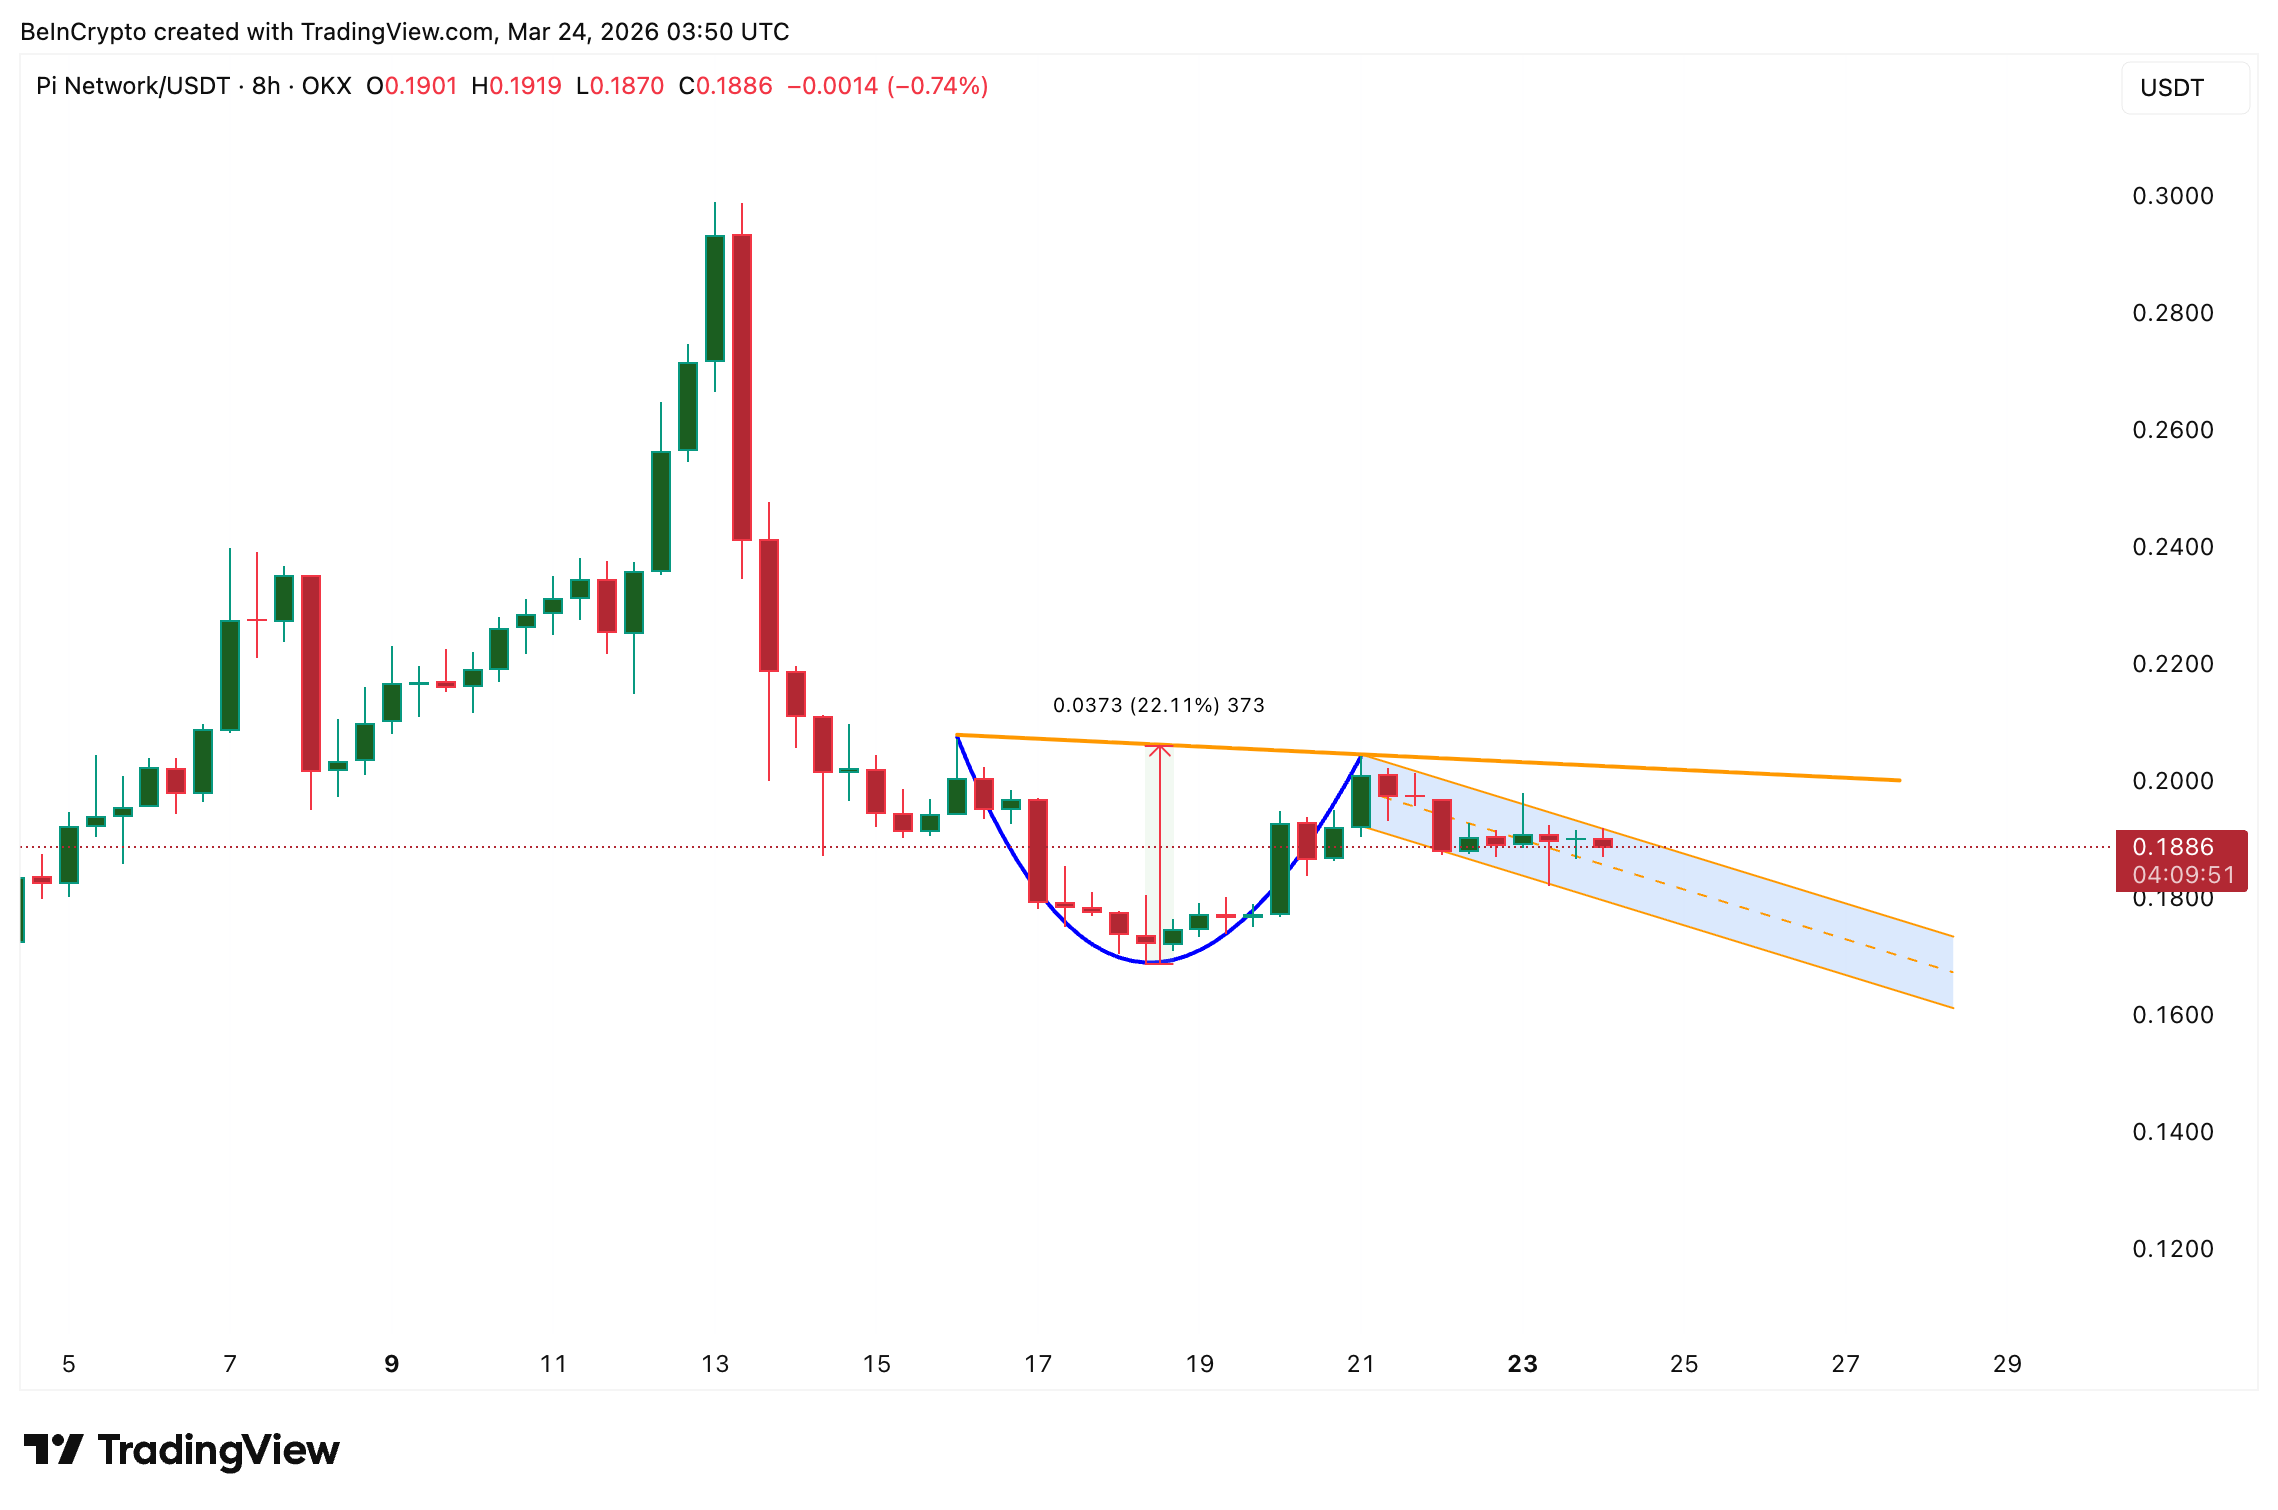 (Source: TradingView)
The 8-hour chart shows a hidden bullish divergence formed between February 19 and March 23: PI’s price made higher lows on the candlestick chart, while RSI made lower lows during the same period. Hidden bullish divergence generally suggests diminishing selling force within the current structure, favoring trend continuation rather than reversal.
Since mid-March, the cup-and-handle pattern has been gradually forming, with the cup’s arc bottom forming around March 15-19. The current price movement is consolidating within the handle area. If PI closes above $0.200 on the 8-hour timeframe (the 50% Fibonacci retracement), and further confirms a breakout above the neckline at $0.204 (the 61.8% Fibonacci level), a target move of about 22% could be triggered, aiming for $0.246. The higher 2.618 Fibonacci extension level is at $0.275.
PISI Near Zero: Why the Breakout Timing Still Requires Waiting
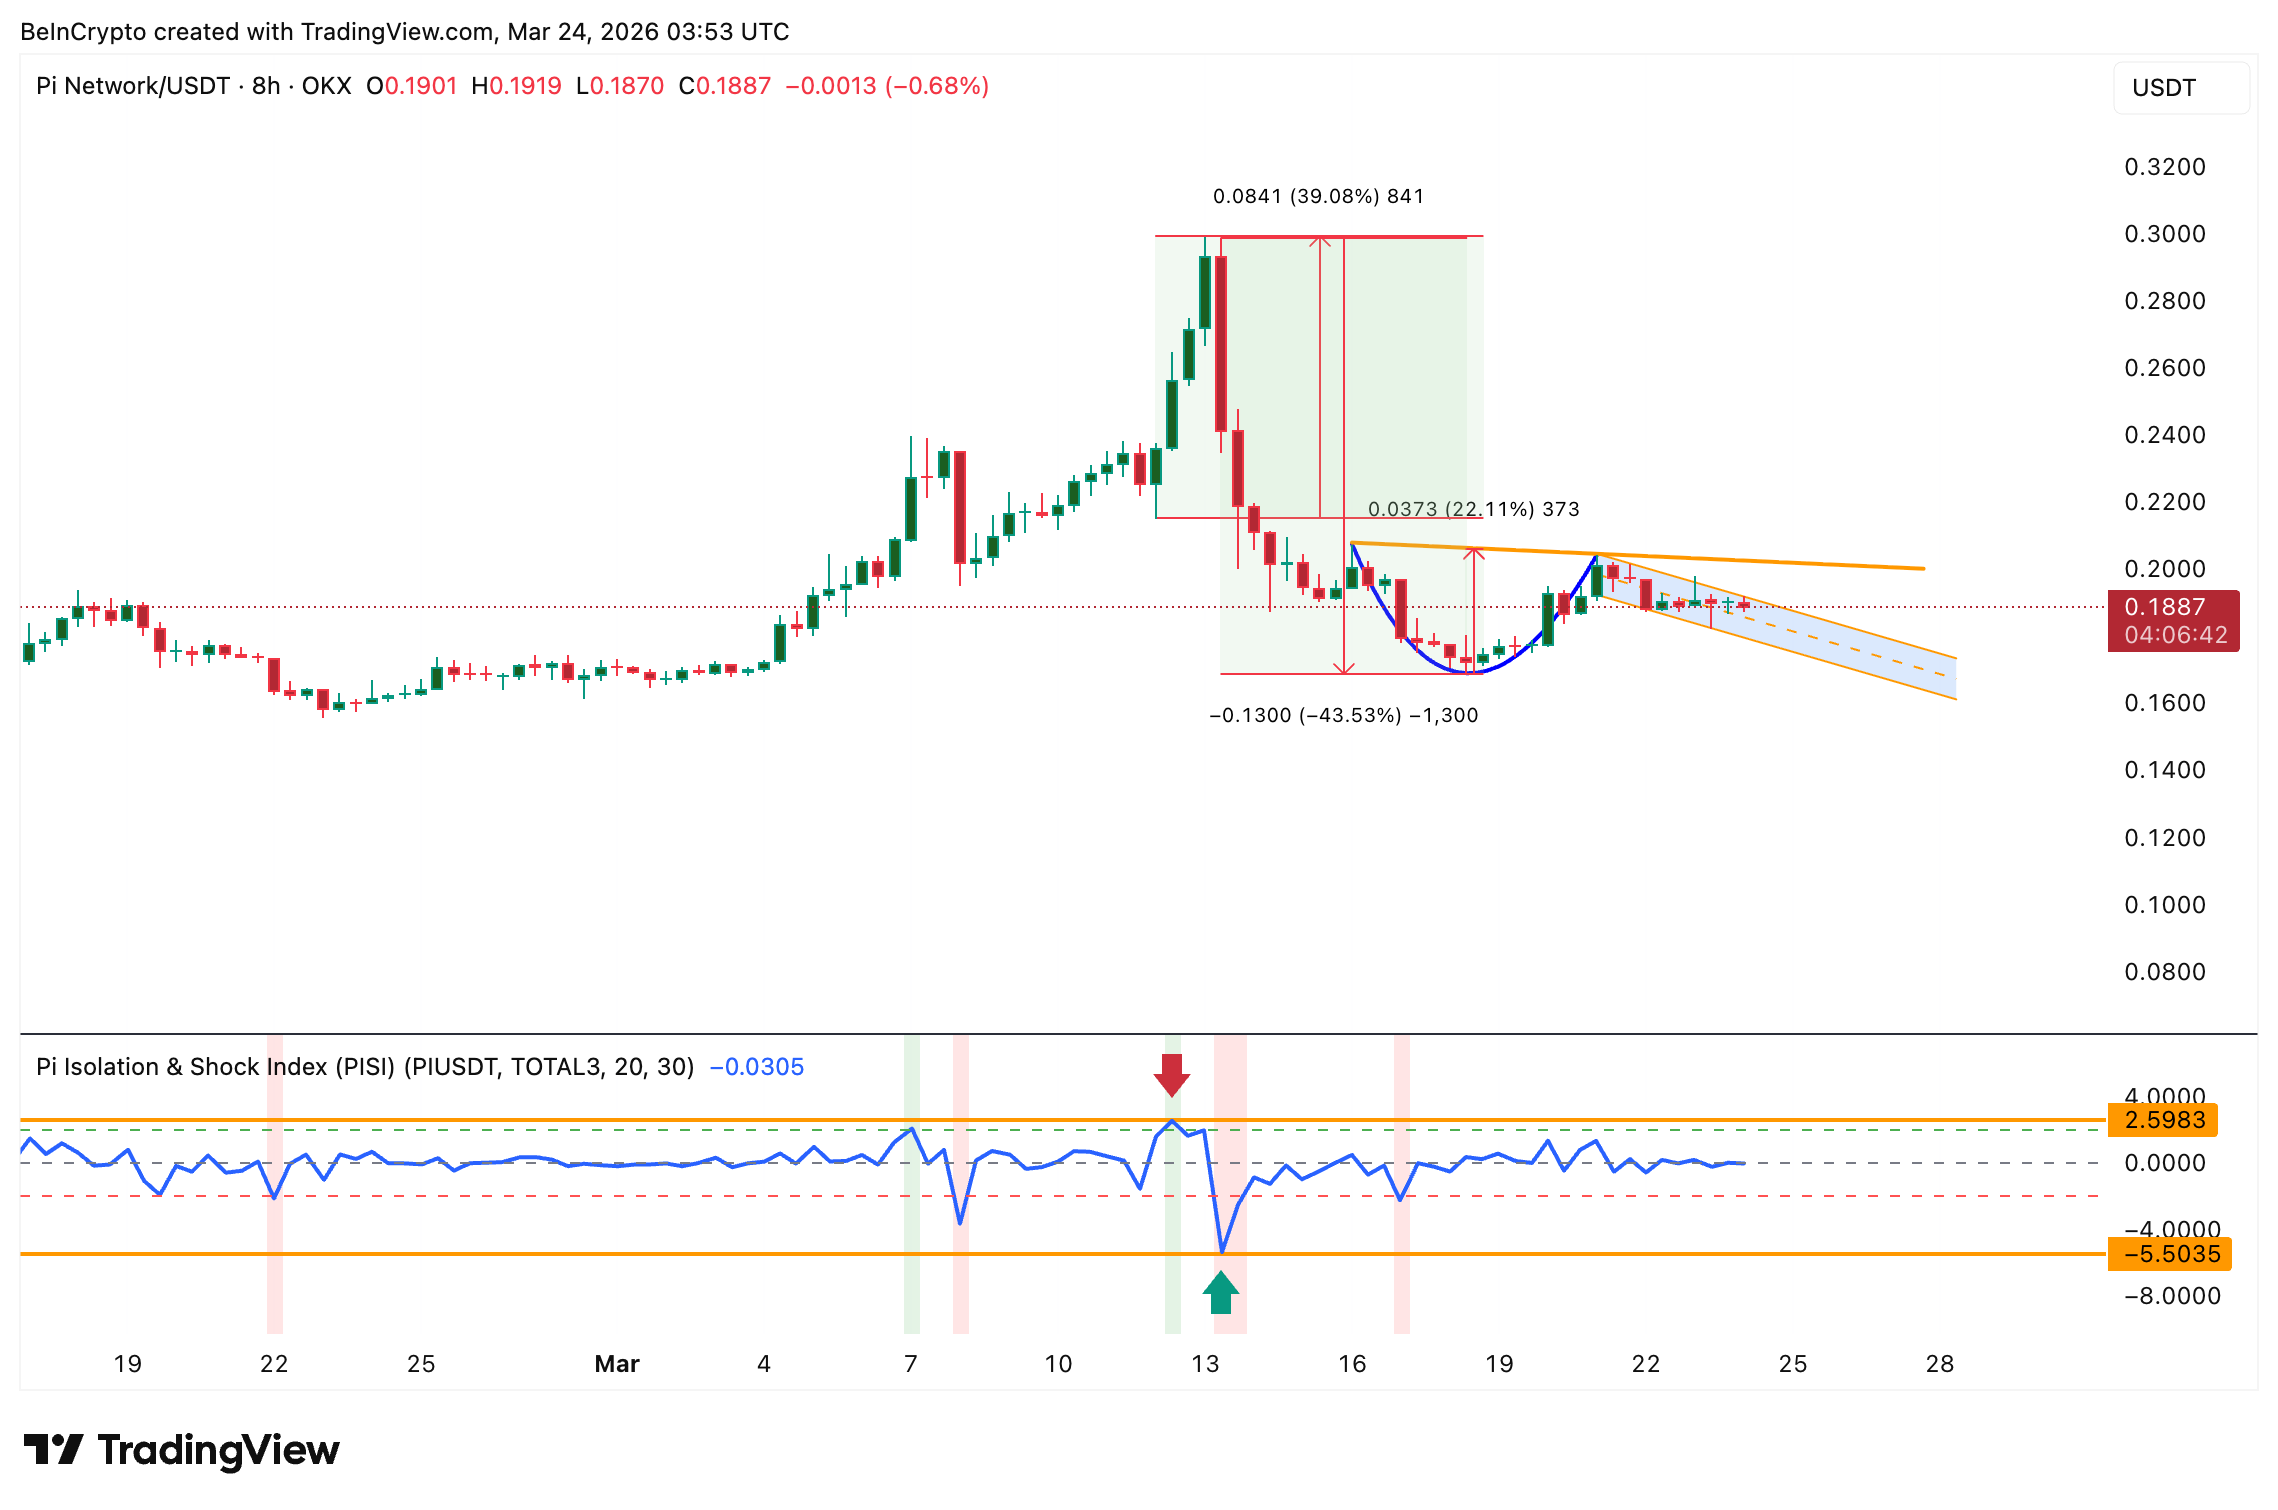 (Source: TradingView)
PISI (Pi Isolation and Shock Index) measures the volatility strength of PI independent of the overall altcoin market (TOTAL3). Currently, the reading is -0.03, almost exactly at zero, indicating that PI lacks autonomous directional momentum at the moment.
Historical Accuracy of the PISI Indicator
- March 12: PISI surged from 1.02 to a peak of 2.59, followed by about 40% increase in PI price.
- March 13: PISI plummeted to -5.50, with PI price subsequently retracing about 43%.
- Currently: PISI at -0.03, close to zero, suggesting sideways consolidation rather than a directional breakout.
One reason for the flat PISI reading is PI’s very low correlation with Bitcoin (BTC)—a correlation coefficient of only 0.11 over the past month. PI’s movements are more aligned with the overall altcoin market, and without external catalysts, it lacks the momentum for a breakout.
CMF Turning Positive and Key Technical Levels
However, the Chaikin Money Flow (CMF) is signaling a different story. On the 8-hour chart, CMF has just crossed above zero, with a reading of 0.03. The last time CMF crossed above zero was in late February, which was followed by a sustained upward trend in PI. The current positive crossover, occurring alongside the cup-and-handle pattern and RSI divergence, suggests that large institutional players may have started re-accumulating.
Key technical levels are as follows:
- Resistance: $0.200 (psychological and technical resistance), with confirmation at $0.204 (neckline and 61.8% Fibonacci level).
- Support: $0.182 as immediate support; a break below this could test $0.168. If the 8-hour closing price falls below $0.168, the cup-and-handle pattern would be invalidated.
Frequently Asked Questions
Q: What does the cup-and-handle pattern mean for Pi Network?
A: The pattern consists of a rounded bottom (cup) followed by a consolidation (handle). The target upside is estimated based on the depth of the cup. In this case, breaking above $0.204 could lead to about 22% gains, targeting $0.246, with higher Fibonacci extensions at $0.275.
Q: What does PISI near zero imply for Pi Network?
A: It indicates that PI currently lacks independent momentum and is following the overall altcoin market trend. Historically, significant deviations from zero in PISI have preceded strong directional moves. The current reading of -0.03 suggests sideways movement rather than an immediate breakout.
Q: What are the key support and resistance levels for Pi Network now?
A: Resistance levels are at $0.200 (initial resistance) and $0.204 (breakout confirmation). Support levels are at $0.182, with a secondary support at $0.168. A close below $0.168 would invalidate the cup-and-handle pattern.
Disclaimer: The information on this page may come from third parties and does not represent the views or opinions of Gate. The content displayed on this page is for reference only and does not constitute any financial, investment, or legal advice. Gate does not guarantee the accuracy or completeness of the information and shall not be liable for any losses arising from the use of this information. Virtual asset investments carry high risks and are subject to significant price volatility. You may lose all of your invested principal. Please fully understand the relevant risks and make prudent decisions based on your own financial situation and risk tolerance. For details, please refer to
Disclaimer.
