
Bitcoin price is once again testing patience after weeks of sideways movement, and a fresh chart observation is now pointing to a very tight timing window. The latest BTC price structure suggests that what looks like weakness may actually be the final phase before a stronger move begins.
The chart shared by Ali Charts shows a clear pattern that has played out before. That pattern now places Bitcoin at a critical point where the next few days could define the next major direction.
A look at the Bitcoin 3-day chart reveals something important about the current cycle. After the October 2025 peak, BTC price dropped sharply and completed a correction of about 52%. That aligns closely with previous cycle pullbacks where large corrections occurred before continuation moves.
Ali Charts pointed out that on February 27, 2026, the 3-day simple moving average crossover appeared again. That same signal has historically marked late-stage corrections before price stabilizes and reverses higher. The timing matters here because Bitcoin is now about 30 days into that signal.
The chart visually shows a previous drop of 52.47% followed by consolidation. A projected move now suggests a possible final decline of around 48.95% from peak zones. That projection lines up with a downside region near $30,000 if the pattern fully plays out, although current price action still holds well above that level.
Another key detail stands out on the chart. BTC price is trading below both the 50 SMA and the 200 SMA on the 3-day timeframe. That position often appears late in corrections, not at the start of new downtrends. The slope of the shorter moving average is still pointing downward, which means pressure has not fully cleared yet.
Ali Charts emphasizes that if history repeats in structure, Bitcoin could enter what is often called a final accumulation window within the next 3 to 6 days. That window typically represents the period where stronger buyers begin stepping in quietly.
- Bitcoin Price Structure In 2026 Shows Range Formation Instead Of Collapse
- Bitcoin Market Conditions Point To Early Accumulation Phase
- Key Bitcoin Price Levels That Could Define The Next Move
Bitcoin Price Structure In 2026 Shows Range Formation Instead Of Collapse
Recent Bitcoin price action gives more context to this idea. BTC reached about $98,000 on January 13, 2026, and now trades near $66,200. That represents a drop of roughly 32% from that local high.
Price action since then has not followed a straight downward path. BTC price sold off hard in February, then transitioned into a wide sideways range. That type of movement often appears after strong rallies when markets need time to cool down.
The structure shows a clear high above $90,000 followed by a sharp decline. What followed is not panic selling but a two-month period of consolidation. That tells a different story from a full trend breakdown.
Momentum indicators support this view. The 7-day SMA sits near $67,201, slightly above the current price. The 30-day SMA around $69,579 remains overhead resistance. The 200-day SMA is much higher near $90,349, which confirms that the broader trend still has distance before turning fully bearish.
RSI around 42 adds another piece to the puzzle. That level shows weakness, but not extreme selling pressure. It fits a market that is stabilizing rather than collapsing.
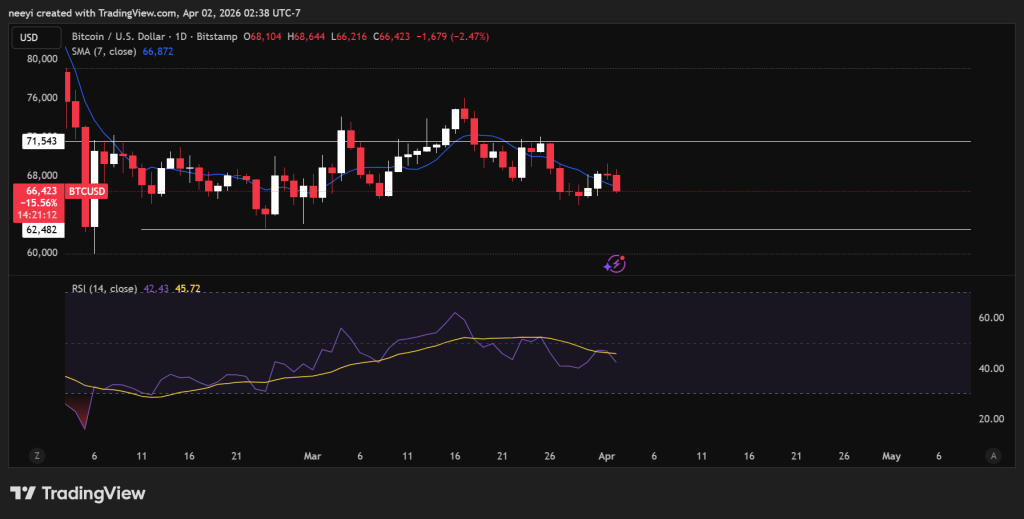
BTC Price Chart / Source: TradingView.com
Bitcoin Market Conditions Point To Early Accumulation Phase
Another factor that deserves attention is how leverage has changed across the market. Global open interest dropped from about $867B to around $408B since early January. That is a decline of roughly 53%, which means excessive leverage has already been flushed out.
Funding rates have turned slightly negative, which shows that aggressive long positioning has reduced. BTC liquidations over the past 30 days reached about $3.48B. That level is notable but does not represent a full market reset.
Sentiment also adds context. The crypto market cap has declined about 25% since early January. The Fear and Greed Index now sits near 27, which places it firmly in the Fear zone. This type of sentiment usually appears when markets are uncertain but not broken.
Why Is StakeStone (STO) Price Pumping?_**
All these elements together point toward a phase where stronger hands gradually absorb supply. That fits the idea of accumulation rather than panic exit.
Key Bitcoin Price Levels That Could Define The Next Move
Bitcoin price is currently moving within well-defined zones. Resistance sits between $75,000 and $80,000, where previous rebounds have stalled. The mid-range area between $66,000 and $72,000 continues to act as a battleground.
Support between $60,000 and $65,000 remains the most important region right now. That zone has held multiple times and aligns with recent lows.
A final stage of accumulation would likely show repeated holds above that support range with slightly higher lows forming over time. Price would also need to compress volatility, which often appears before expansion moves.
Here’s Why Silver Price Is Crashing_**
A decisive move above $75,000 could change the structure and turn resistance into support. That would open the door for Bitcoin to revisit higher zones between $85,000 and $95,000 later in the year.
A different path remains possible. Failure to hold $60,000 could push BTC price into the mid $50,000 region before stronger buyers step in again. That scenario would delay the recovery but could still lead to a more stable base.
Disclaimer: The information on this page may come from third parties and does not represent the views or opinions of Gate. The content displayed on this page is for reference only and does not constitute any financial, investment, or legal advice. Gate does not guarantee the accuracy or completeness of the information and shall not be liable for any losses arising from the use of this information. Virtual asset investments carry high risks and are subject to significant price volatility. You may lose all of your invested principal. Please fully understand the relevant risks and make prudent decisions based on your own financial situation and risk tolerance. For details, please refer to
Disclaimer.
