政和徐婷
vip
Futures Trading Strategist
Quant Trader
Peak Tier 12
No content yet
Pin
  • Reward
  • 1
  • Repost
  • Share
There is a 98% probability of a 25 basis point rate cut. The previous two rate cuts did not lead to a significant rally. Will this one drive an increase? Will Trump announce the successor to the Federal Reserve before Christmas? #十二月行情展望
View Original
post-image
post-image
  • Reward
  • Comment
  • Repost
  • Share
Comprehensive ETH$ETH Trading Recommendations for Today (December 7)
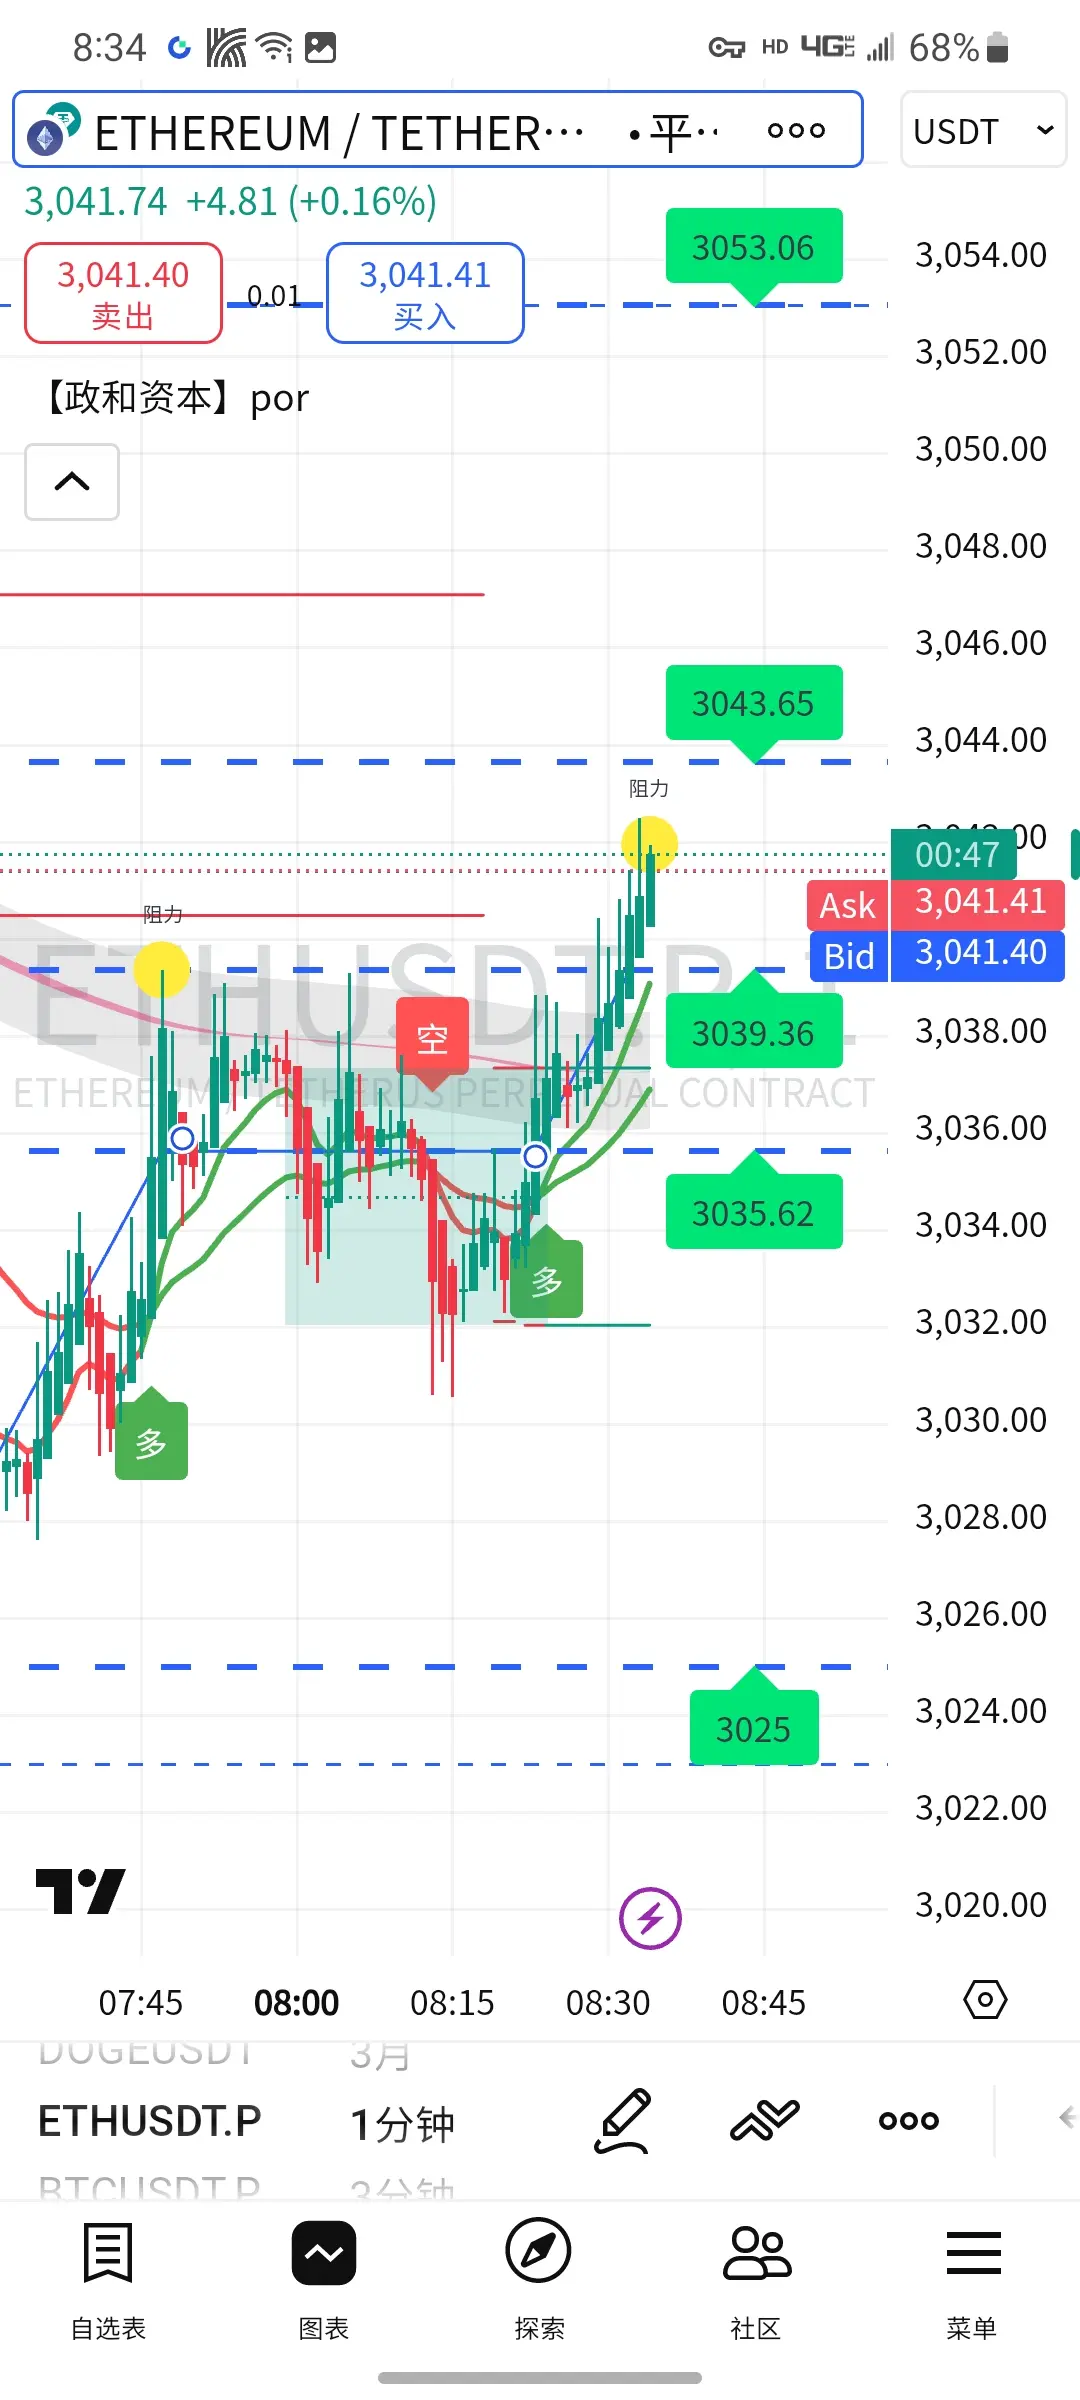
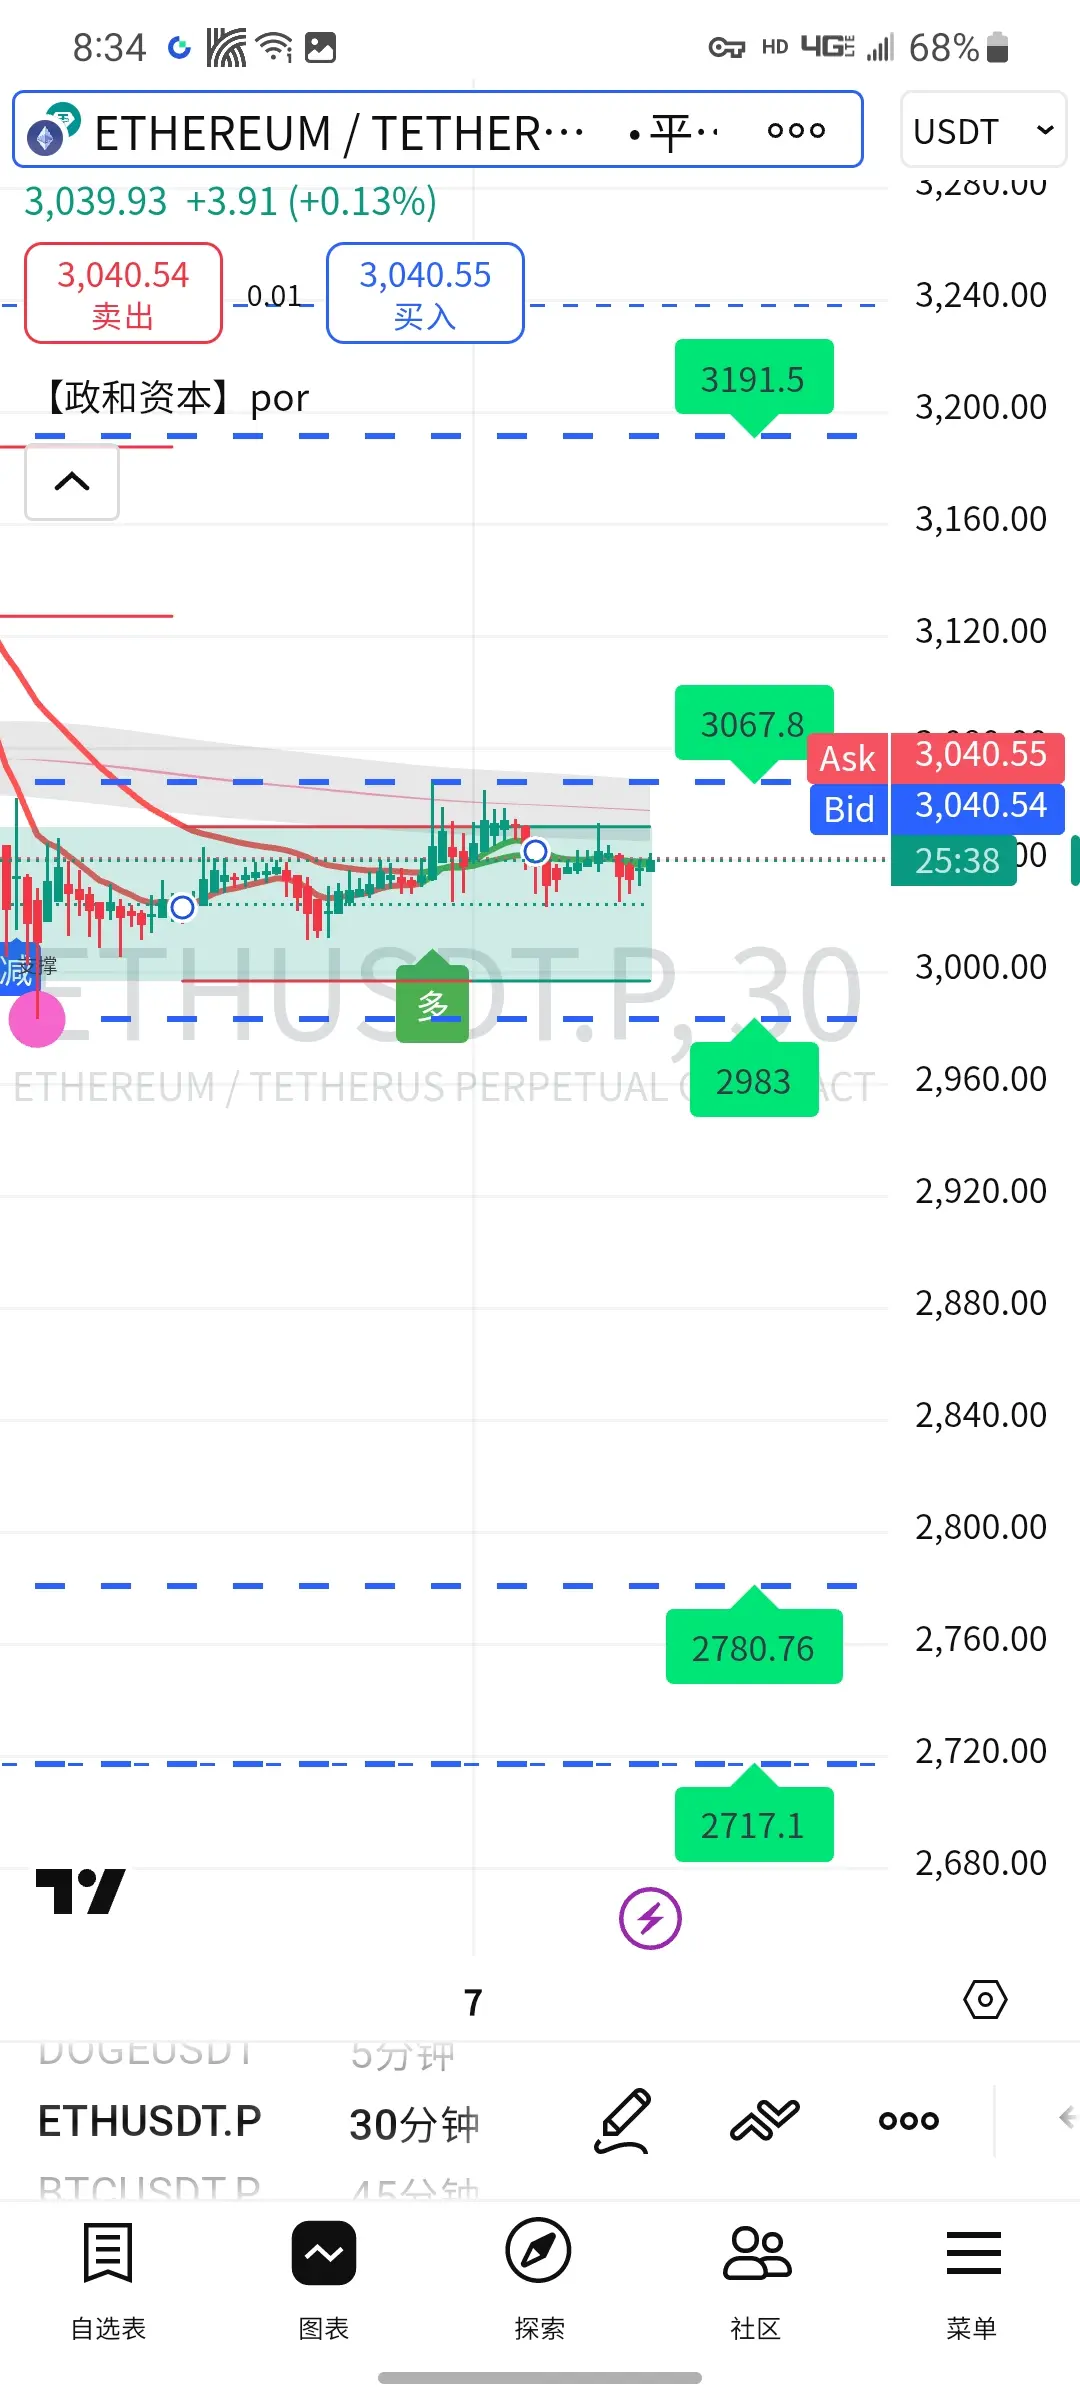
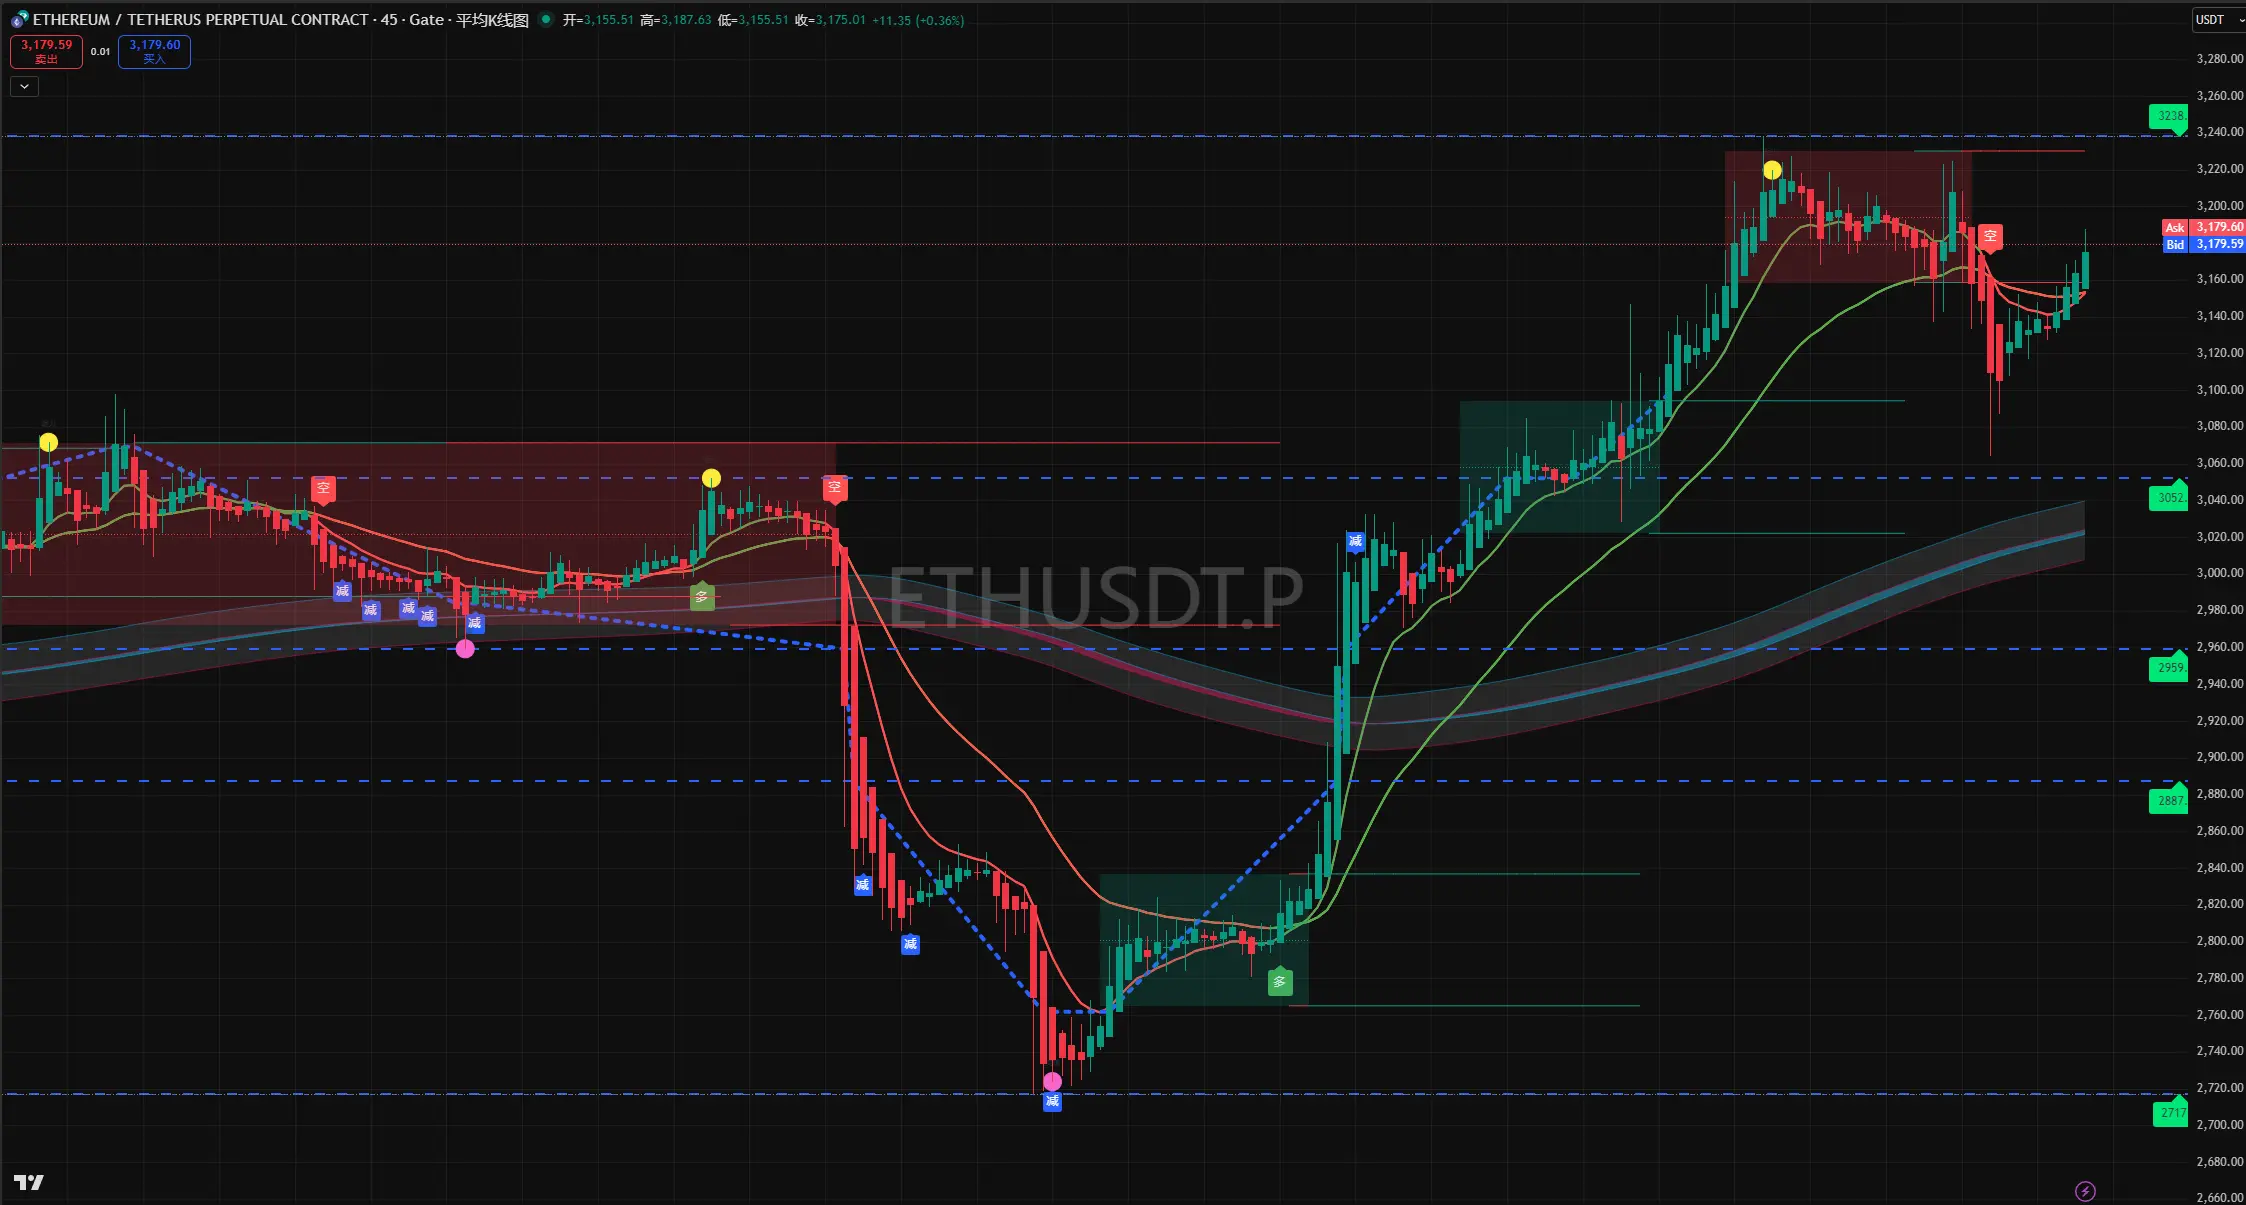
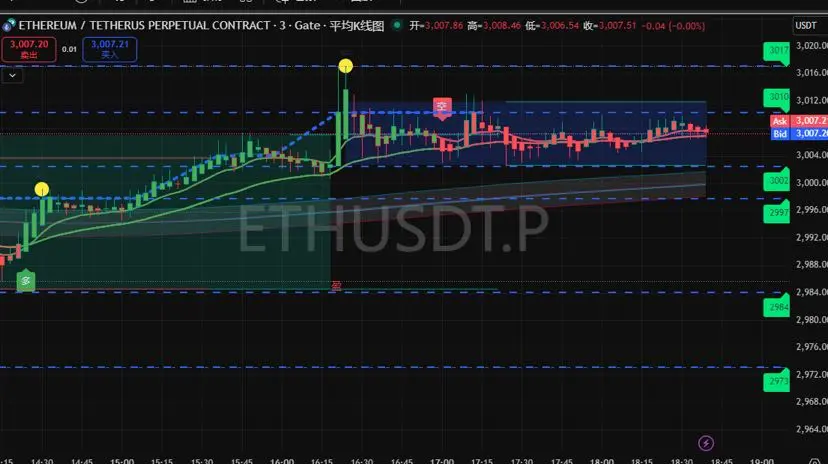
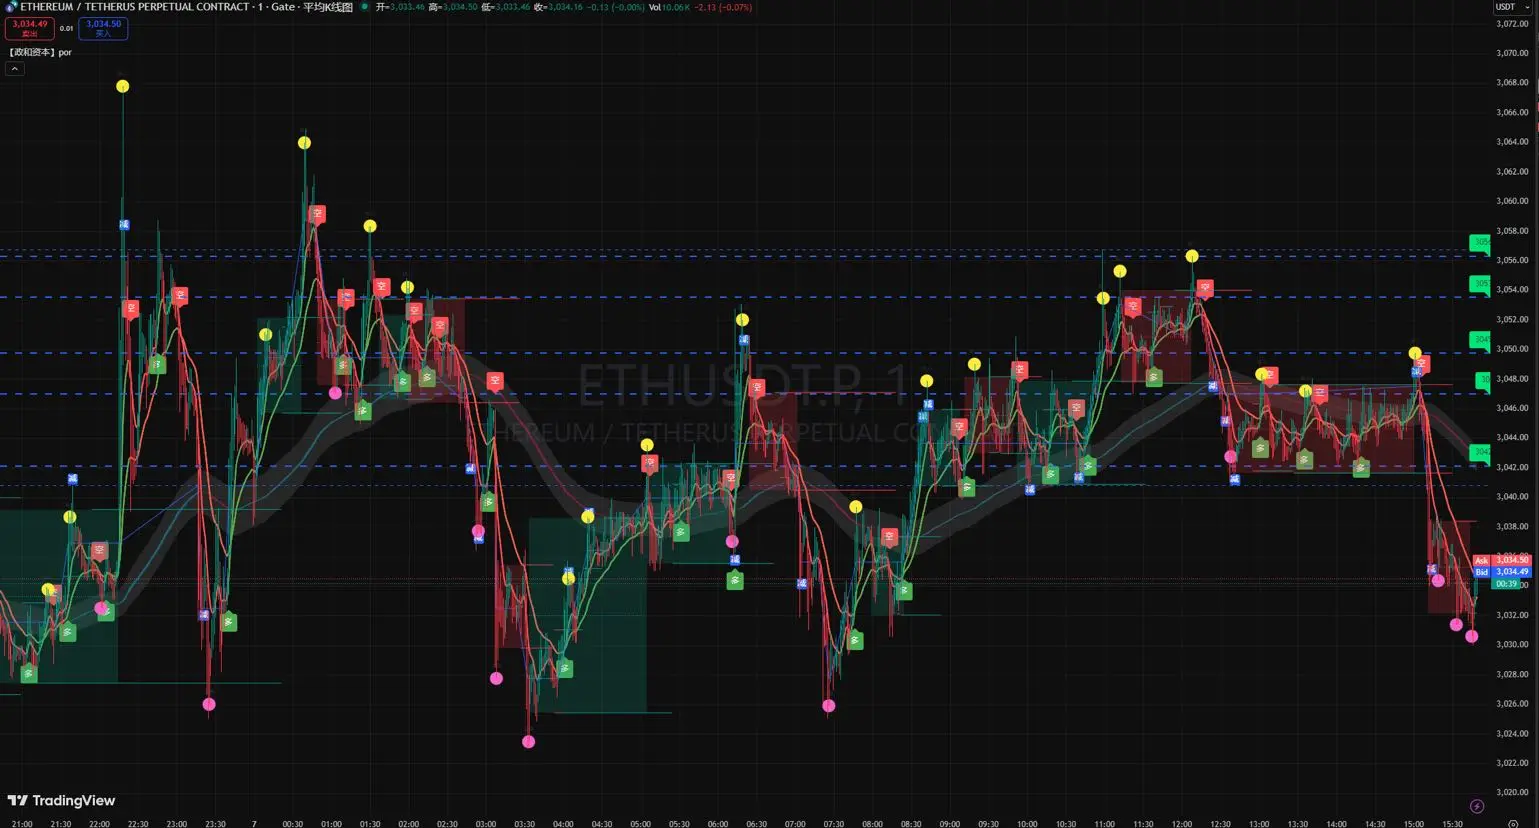
Current Core Dispute: The $3,000 Level
· Current Status: As of December 6/7, Ethereum’s price is fluctuating around $3,020–$3,050, testing this key support.
Main Reasons for Bullish (Long) Viewpoints
· Core Logic: Key support is holding, offering potential for a technical rebound and structural opportunities.
· Key Support: Institutional buying is providing support near $3,000.
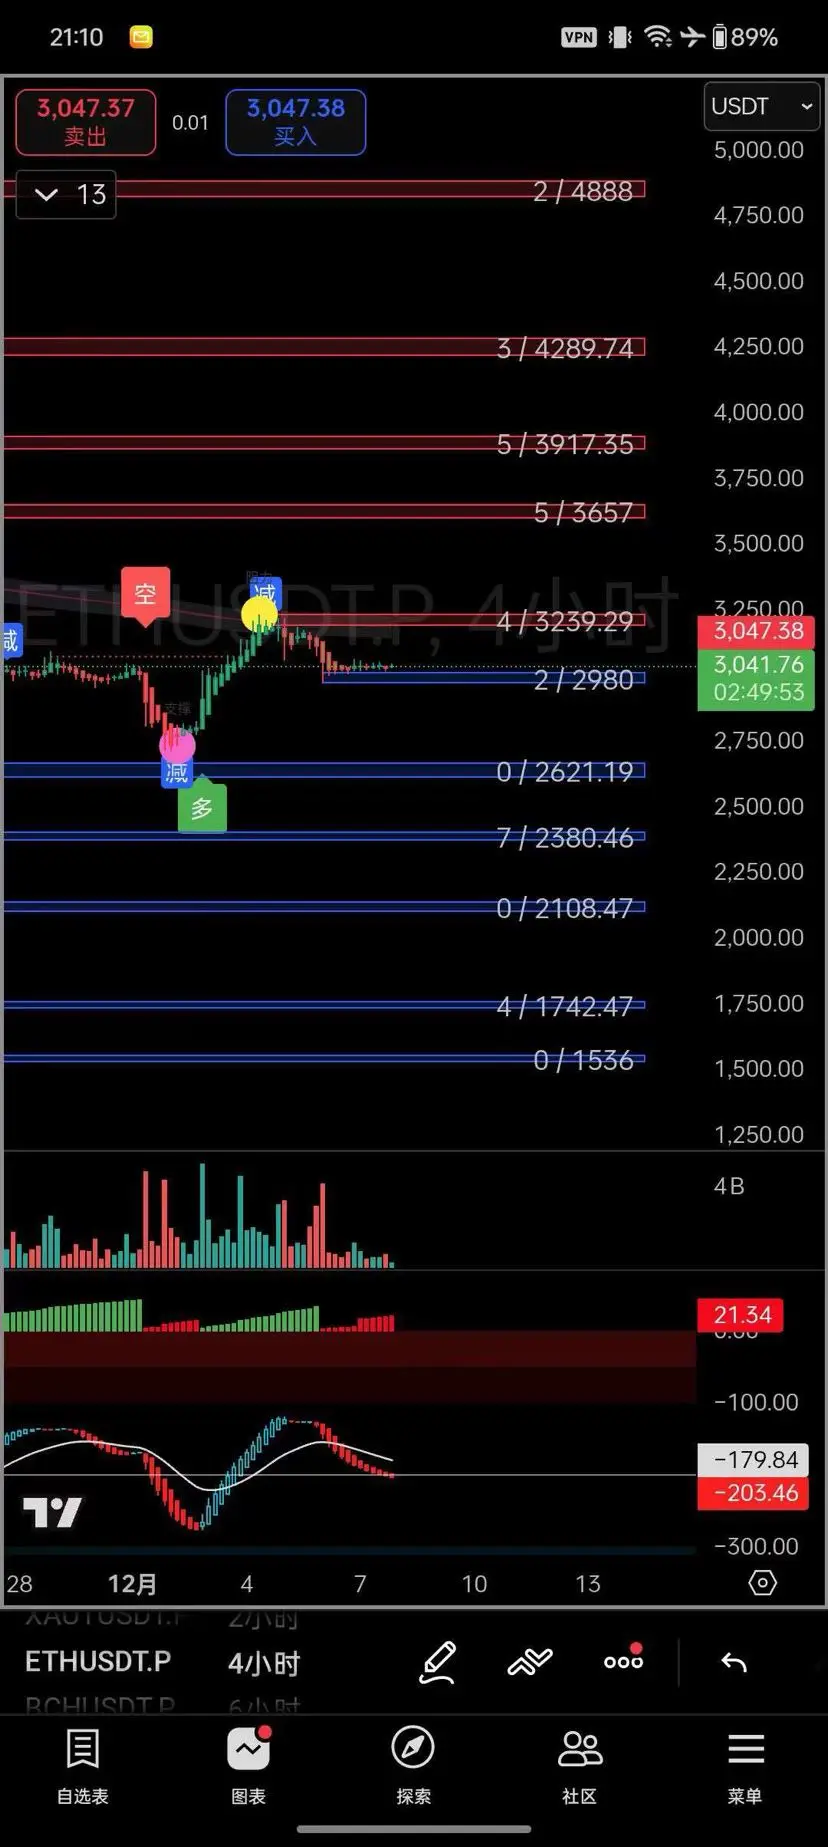
· Technical Pattern: The ETH/BTC ratio has broken above a descending trendline, indicating market risk appetite may be returning; if it breaks above
ETH3.06%
View Original
  • Reward
  • Comment
  • Repost
  • Share
Ultra-stable trading system! $ETH
ETH3.06%
View Original
post-image
  • Reward
  • Comment
  • Repost
  • Share
On December 7, 2025, ETH is exhibiting a narrow-range oscillation pattern under bearish reversal signals, with short-term momentum weakening and the risk of a pullback rising. The core technical analysis is as follows:
1. Price and Key Levels: The current price is around $3,050, in a consolidation phase. Short-term key support is focused on the $3,025 - $3,040 range, which has been tested multiple times on the 2-hour chart and has formed support. A stronger support lies below at $2,850 - $2,900, which corresponds to the recent trend line and key on-chain cost area. On the upside, initial resis
ETH3.06%
View Original
post-image
post-image
  • Reward
  • Comment
  • Repost
  • Share
On December 7, 2025, BTC is exhibiting a volatile recovery posture. In the short term, there is minor rebound momentum, but medium- to long-term bearish pressure remains. Core technical analysis is as follows:
1. Price and Key Levels: After the market opened, the price fluctuated around $89,136, once approaching $90,000 during the session. The 24-hour high reached $90,273.97, and the low was $89,002. The core support zone is concentrated at $88,000 - $90,000, which is not only the recent rebound starting point but also the Bitcoin production cost line. Resistance above is focused at $94,000 -
BTC2.12%
View Original
post-image
post-image
  • Reward
  • Comment
  • Repost
  • Share
Weekend $ETH sideways farming begins!
ETH3.06%
View Original
post-image
  • Reward
  • Comment
  • Repost
  • Share
On December 5, 2025, Ethereum displayed technical characteristics of post-oversold recovery followed by consolidation. Although there was a rebound, clear resistance remains. Detailed analysis:
1. Price Movement and Key Levels: On December 4, Ethereum surged to 3240 before falling back due to selling pressure and dipped to a low of 3064 in the evening along with the broader market. It then rebounded quickly, and by the 5th, had recovered to around 3150, reclaiming most of the lost ground. The current key support levels are at the 3100 mark and the recent low of 3064. 3100 serves as short-term
ETH3.06%
View Original
post-image
  • Reward
  • Comment
  • Repost
  • Share
Regarding Ethereum $ETH trading recommendations for today, the price has already broken through $3,200 during the session, which is a key observation point.
Core Views and Potential Paths
The current market is centered around the key level of $3,200, and there are mainly two perspectives:
1. Bullish View: Breakout Upward: If the price can effectively hold and break through the $3,100–$3,200 resistance zone, a new upward trend may begin. The next important target is $3,400–$3,850, and some analysts have mentioned a mid- to long-term target of $5,000. A well-known investor, Yilihua, also public
ETH3.06%
View Original
post-image
post-image
  • Reward
  • Comment
  • Repost
  • Share
  • Reward
  • 1
  • 1
  • Share
政和徐婷vip:
15:47 got it 🖕
Ethereum $ETH price movement is mainly positively correlated with the Fed's rate cuts; rate cuts usually drive its price to pump, but in special scenarios like recessionary rate cuts, this correlation can weaken or even reverse. The specific relationship is as follows:
1. Conventional rate cuts drive price movement: The Fed's rate cuts increase market liquidity, reduce borrowing costs for banks and corporate financing, and funds that would originally be directed towards low-yield assets like bonds will shift towards high-return risk assets like Ethereum. At the same time, rate cuts ar
ETH3.06%
View Original
  • Reward
  • 1
  • Repost
  • Share
StrongBrotherΠvip:
Just go for it💪
The Fed's interest rate cut situation in December shows that the current market and institutions widely expect a 25 basis point cut from the Fed in December, but there is still some uncertainty. Here are the detailed predictions from the Fed:
1. Institutional Forecasts: JP Morgan adjusted its forecast twice within a week, ultimately believing that the Fed will lower interest rates by 25 basis points in December, with another cut expected in January next year; Goldman Sachs also anticipates that the Fed will implement a third consecutive rate cut in December, citing slowing inflation and a
View Original
post-image
  • Reward
  • Comment
  • Repost
  • Share
Ethereum $ETH has recently shown a fluctuating downward trend in price, significantly retreating from the historical high point in August, while short-term fluctuations are evident. The specific trend is as follows:
1. Short-term trend: As of November 30, 2025, the price of Ethereum is approximately $3020 - $3040. In the past 24 hours, the price fluctuated between $2961 - $3045, with a decline of about 1.34%-1.46%; looking back over the past week (November 23 - November 30), although there was a single-day increase of 5.39% on November 24, the overall trend has been a decline, fluctuating fro
ETH3.06%
View Original
post-image
  • Reward
  • 8
  • 1
  • Share
可爱的小新vip:
Hold on tight, we're taking off To da moon 🛫
View More
BTC market data and key price analysis
Price and recent trends: BTC fluctuated in a narrow range of 90155 - 91165 USD on the day, currently trading around 90800 USD. The 4-hour chart shows that it has dropped from a high of 93092 USD and is stuck near the middle band of the Bollinger Bands. The MACD shows a death cross, but the green bars have not expanded. The KDJ shows signs of turning, with bullish and bearish forces temporarily balanced. Trading volume is gradually shrinking, and there is a strong wait-and-see sentiment in the market.
Key price levels: The upper resistance level to watch i
BTC2.12%
View Original
post-image
  • Reward
  • Comment
  • Repost
  • Share
Analysis of Zhenghe ETH market data and key price levels
Price and Recent Trends: The performance of ETH has been quite volatile today, first breaking below the 3000 US dollar threshold, hitting a low of 2960 US dollars, after previously soaring to 3099 US dollars and then quickly coming under pressure. As of the afternoon, both the hourly and 4-hour charts are showing a fluctuating trend, with rebound volume gradually decreasing, and it has already fallen below the short-term upward trend channel, facing significant selling pressure for any subsequent rebound.
Key price levels: Short-term res
ETH3.06%
View Original
post-image
  • Reward
  • 1
  • Repost
  • Share
AnchorXuTingvip:
Just go for it💪
ETH Zhenghe Technical Analysis Report for Late November 2025
Recent market background: Ethereum also experienced a significant decline in November, with a monthly drop of 24.8%, falling from $3918 to $2946. On the 27th, the market rebounded and broke through the key psychological level of $3000, and on the 28th, the price faced resistance and pulled back around the $3070 level, entering a consolidation phase.
Interpretation of Core Technical Indicators
MACD Indicator: The daily level histogram has turned red for five consecutive days, although it remains below the zero line, the momentum recov
ETH3.06%
View Original
post-image
  • Reward
  • Comment
  • Repost
  • Share
BTC Zhenghe Technical Analysis Report for Late November 2025
Recent market background: Bitcoin experienced a significant plunge in November, dropping from its historical peak of $126,000 on October 12 to a phase low of $89,000 on the 18th, a decline of 29%. On the 27th, it saw a strong rebound, returning to the $90,000 mark, and on the 29th, it was in a box consolidation phase, maintaining the $91,000 level, with intense long and short battles.
Interpretation of Core Technical Indicators
RSI Indicator: The daily RSI reading has rebounded from the oversold area, indicating a relief in downward
BTC2.12%
View Original
post-image
  • Reward
  • Comment
  • Repost
  • Share
11.30 short-term operation: The current price fluctuates around 2995, with short-term support at 2960 and resistance levels at 3048 - 3100. You can go long near 2970 - 2980, set a stop loss of 50 points, and aim for 3020 - 3040; you can try shorting in the range of 3025 - 3100, set a stop loss of 50 points, and aim for a downward target of 3000 - 2950. If the 2960 support holds, you can perform ultra-short northbound operations, and exit promptly if it breaks down.
Medium-term outlook: The medium-term support is at 2750, with strong resistance at 3170 above. If the price can stabilize at 3100
ETH3.06%
View Original
post-image
  • Reward
  • Comment
  • Repost
  • Share
On November 29, 2025, Ethereum $ETH will move in tandem with Bitcoin, showing a high-level fluctuation pattern. Additionally, the trading volume over the weekend is likely to be low, and the fluctuation will be narrow. The trading strategy is recommended to focus on buying low and selling high within the range, while operating with a light position. At the same time, closely monitor key data and points, as detailed below:
1. Long Strategy: You can try long positions in the 3000 - 2990 range. If it pulls back and stabilizes at 2937, you can also try a Light Position. A more conservative long p
ETH3.06%
View Original
post-image
  • Reward
  • 3
  • Repost
  • Share
GateUser-bd346df0vip:
You did a great job publishing, your letters are exceptional 🥰🥰🥰🥰🥰
View More
Technical Analysis and trading strategy for政和 (SOL) on November 29
Key Price Level (USD)
• Support Level: First support at 135, strong support at 130 (the key bottom where multiple rebounds have stabilized, significantly rising after touching this area twice in historical trends), extreme support at 95 (key point of the rising trend line, breaking below will strengthen the downward tone).
• Resistance levels: First resistance at 160 (20-day EMA position), strong resistance at 170 (neckline resistance area of the V-shaped reversal pattern), target resistances at 200, 250 (if the neckline is bro
SOL2.26%
View Original
post-image
  • Reward
  • 1
  • Repost
  • Share
  • Trending TopicsView More
  • Pin
Trade Crypto Anywhere Anytime
qrCode
Scan to download Gate App
Community
  • 简体中文
  • English
  • Tiếng Việt
  • 繁體中文
  • Español
  • Русский
  • Français (Afrique)
  • Português (Portugal)
  • Bahasa Indonesia
  • 日本語
  • بالعربية
  • Українська
  • Português (Brasil)