
The Bitcoin price slipped about 2% today, trading slightly below $68,000 after pushing above $73,000 earlier this week, as already covered on our site. The move added fresh pressure to a market that still feels shaky, especially after several failed attempts to hold higher levels.
Still, not everyone sees this as the start of another major leg down.
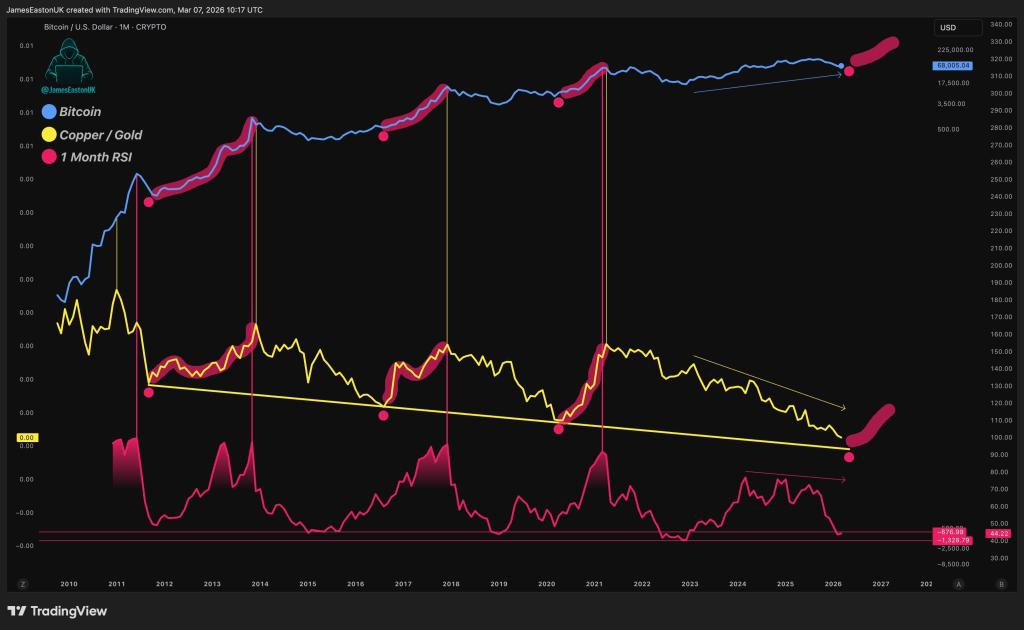
Popular analyst Michaël van de Poppe shared a chart and take on X arguing that Bitcoin may actually be getting closer to a bottom. The chart itself was credited to @JamesEastonUK, and it combines three different signals: Bitcoin price, the 1-month RSI, and the copper-to-gold ratio. Put together, the message is simple: Bitcoin is starting to look a lot like previous late-bear-market phases.
Bitcoin Chart: The RSI Signal Looks Familiar
The clearest part of the chart is the bottom panel, which tracks Bitcoin’s 1-month RSI. Right now, that RSI reading has fallen back to the same zone seen during previous major bear market periods.
That matters because the chart highlights similar monthly RSI lows during 2011–2012, 2015, 2018, and 2022. Each of those periods came near or around major cycle bottoms. In other words, Bitcoin tends to reach this deep monthly momentum reset only when a lot of pain has already happened.
Source: X/@CryptoMichNL
That does not mean price has to bottom immediately. Monthly indicators move slowly, and markets can stay weak for a while even after reaching historically important levels. But it does show that Bitcoin is no longer trading in the kind of overheated environment that usually comes before major crashes. It is already in the kind of zone where long-term bottoms start forming.
Van de Poppe’s main point is that people may be underestimating how advanced this correction already is. After all, the Bitcoin price has already dropped a lot from its highs, sentiment has cooled a lot, and the monthly RSI is now back in territory that has historically lined up with deep bear phases.
The Copper vs. Gold Signal Could Be the Next Trigger
The middle line on the chart is the copper-to-gold ratio, which is often used as a broad macro signal. Copper is seen as a growth-sensitive metal tied to industry and economic activity. Gold usually performs better when investors want safety. So when copper weakens against gold, it often reflects slower growth expectations and a defensive macro environment.
That ratio has been in a long bear trend, and the chart notes that this has become the longest downtrend in the copper-vs-gold relationship since Bitcoin has existed.
That is a big part of the bullish case here.
Van de Poppe argues that if this ratio starts reversing higher, it would point to a stronger business cycle and improving macro conditions. That kind of change would likely support risk assets, including Bitcoin. Not necessarily through a violent straight-up rally, but through a slower, steadier recovery year.
That is why this chart is interesting. It is saying Bitcoin’s monthly structure is already near past bear market levels, and the macro backdrop may be approaching a turning point too.
Read also: Claude AI Predicts the Price of Bitcoin and Ethereum If the CLARITY Act Passes
Disclaimer: The information on this page may come from third parties and does not represent the views or opinions of Gate. The content displayed on this page is for reference only and does not constitute any financial, investment, or legal advice. Gate does not guarantee the accuracy or completeness of the information and shall not be liable for any losses arising from the use of this information. Virtual asset investments carry high risks and are subject to significant price volatility. You may lose all of your invested principal. Please fully understand the relevant risks and make prudent decisions based on your own financial situation and risk tolerance. For details, please refer to
Disclaimer.