


#GateSquareAprilPostingChallenge
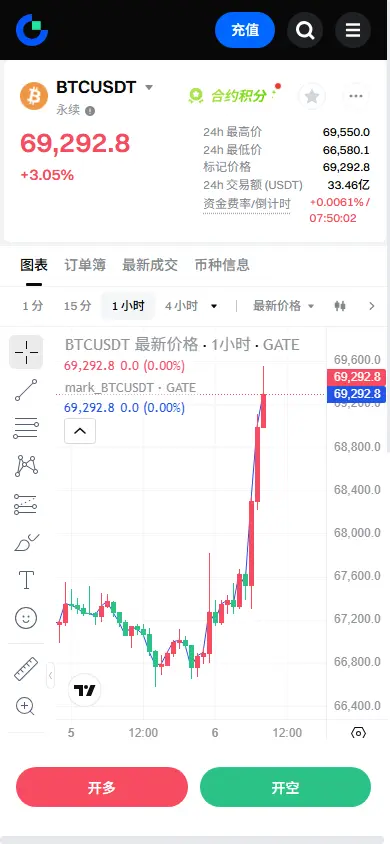
On April 5, 2026, the price of Bitcoin was $66,992 with a market capitalization of $1.34 trillion and a 24-hour trading volume of $19.69 billion. The price fluctuated within a narrow daily range from $66,633 to $67,469, indicating continued consolidation without a clear directional movement.
Bitcoin shows weak confidence amid negative signals
Key takeaways:
On April 5, 2026, Bitcoin hovered around the $66,992 mark; weak momentum signals limit the potential for growth.
Bitcoin is trading below the 10- and 200-day moving averages; the bearish structure is putting pressure on the overall sentiment in the cryptocurrency market.
The Bitcoin range of $65,500–$69,500 remains intact; the next step is likely a breakout or a breach.
BITCOIN CHART FORECAST
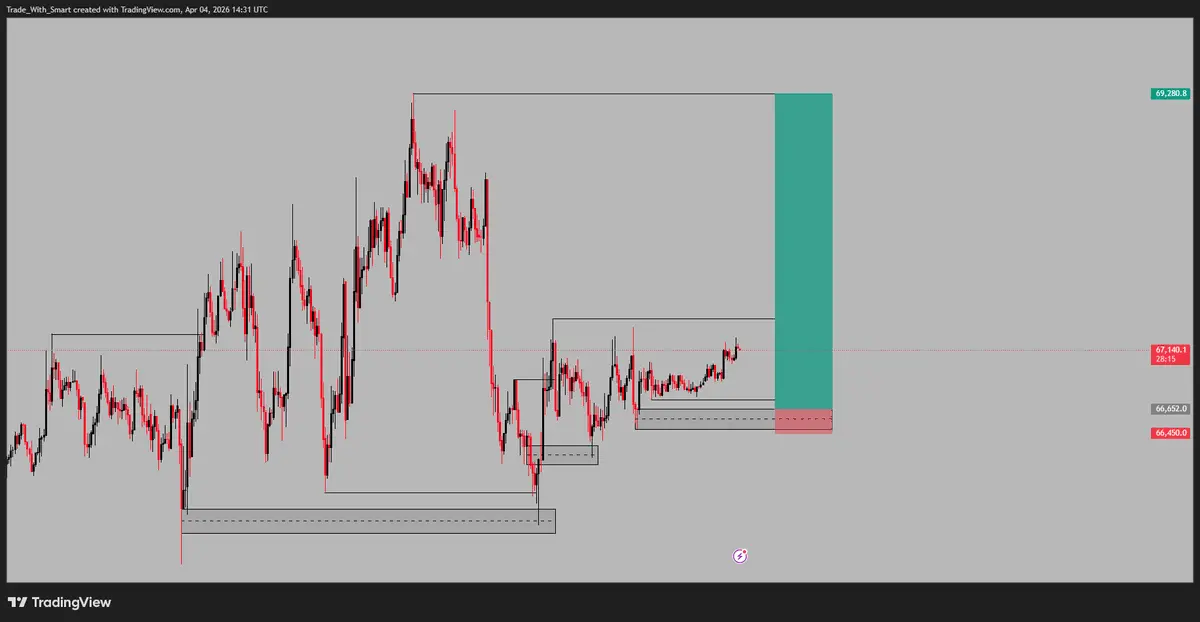
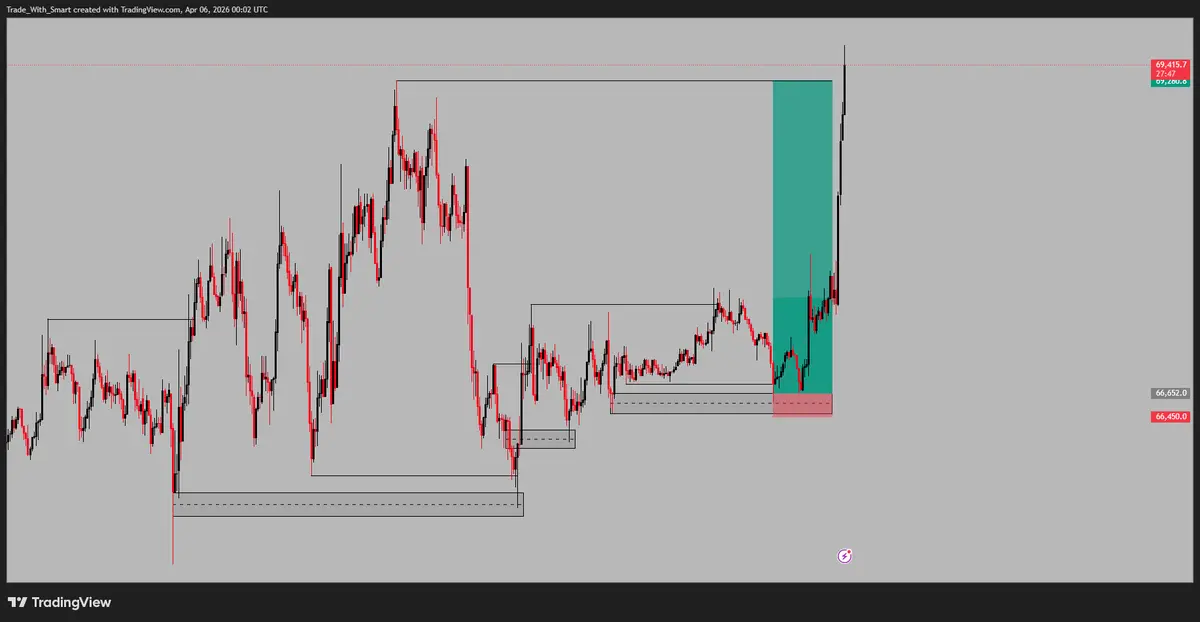
On the daily chart, Bitcoin continues to compress within a broad sideways structure, staying above support around $66,500 but unable to break through resistance near $74,500. The formation of a lower high around the middle of the range $70 000 reinforces the weak bearish bias, although it does not indicate a complete trend reversal. The price remains confined to the lower half of the range, suggesting that sellers still hold a structural advantage, even if the momentum has not yet fully manifested.
On April 5, 2026, the price of Bitcoin was $66,992 with a market capitalization of $1.34 trillion and a 24-hour trading volume of $19.69 billion. The price fluctuated within a narrow daily range from $66,633 to $67,469, indicating continued consolidation without a clear directional movement.
Bitcoin shows weak confidence amid negative signals
Key takeaways:
On April 5, 2026, Bitcoin hovered around the $66,992 mark; weak momentum signals limit the potential for growth.
Bitcoin is trading below the 10- and 200-day moving averages; the bearish structure is putting pressure on the overall sentiment in the cryptocurrency market.
The Bitcoin range of $65,500–$69,500 remains intact; the next step is likely a breakout or a breach.
BITCOIN CHART FORECAST
On the daily chart, Bitcoin continues to compress within a broad sideways structure, staying above support around $66,500 but unable to break through resistance near $74,500. The formation of a lower high around the middle of the range $70 000 reinforces the weak bearish bias, although it does not indicate a complete trend reversal. The price remains confined to the lower half of the range, suggesting that sellers still hold a structural advantage, even if the momentum has not yet fully manifested.