Gate Research: BTCFi Expansion Fuels Starknet’s Rise, as High-Performance L1s and On-Chain Finance Narratives Gain Momentum|Web3 On-Chain Data Insights for November 2025
On-Chain Insights Overview
Overview of On-Chain Activity and Capital Flows
To accurately assess the real usage level of blockchain ecosystems, this section examines several key on-chain activity indicators, including daily transaction volume, gas fees, active addresses, and net cross-chain bridge flows. These metrics capture user behavior, network utilization intensity, and asset mobility across ecosystems. Compared with simply tracking capital inflows and outflows, on-chain native data provides a more comprehensive view of the underlying fundamentals, helping evaluate whether changes in capital direction are supported by genuine usage demand and user growth. This enables the identification of networks with sustainable development potential.
Transaction Analysis: Solana Remains Dominant; Major Chains Maintain Steady Activity
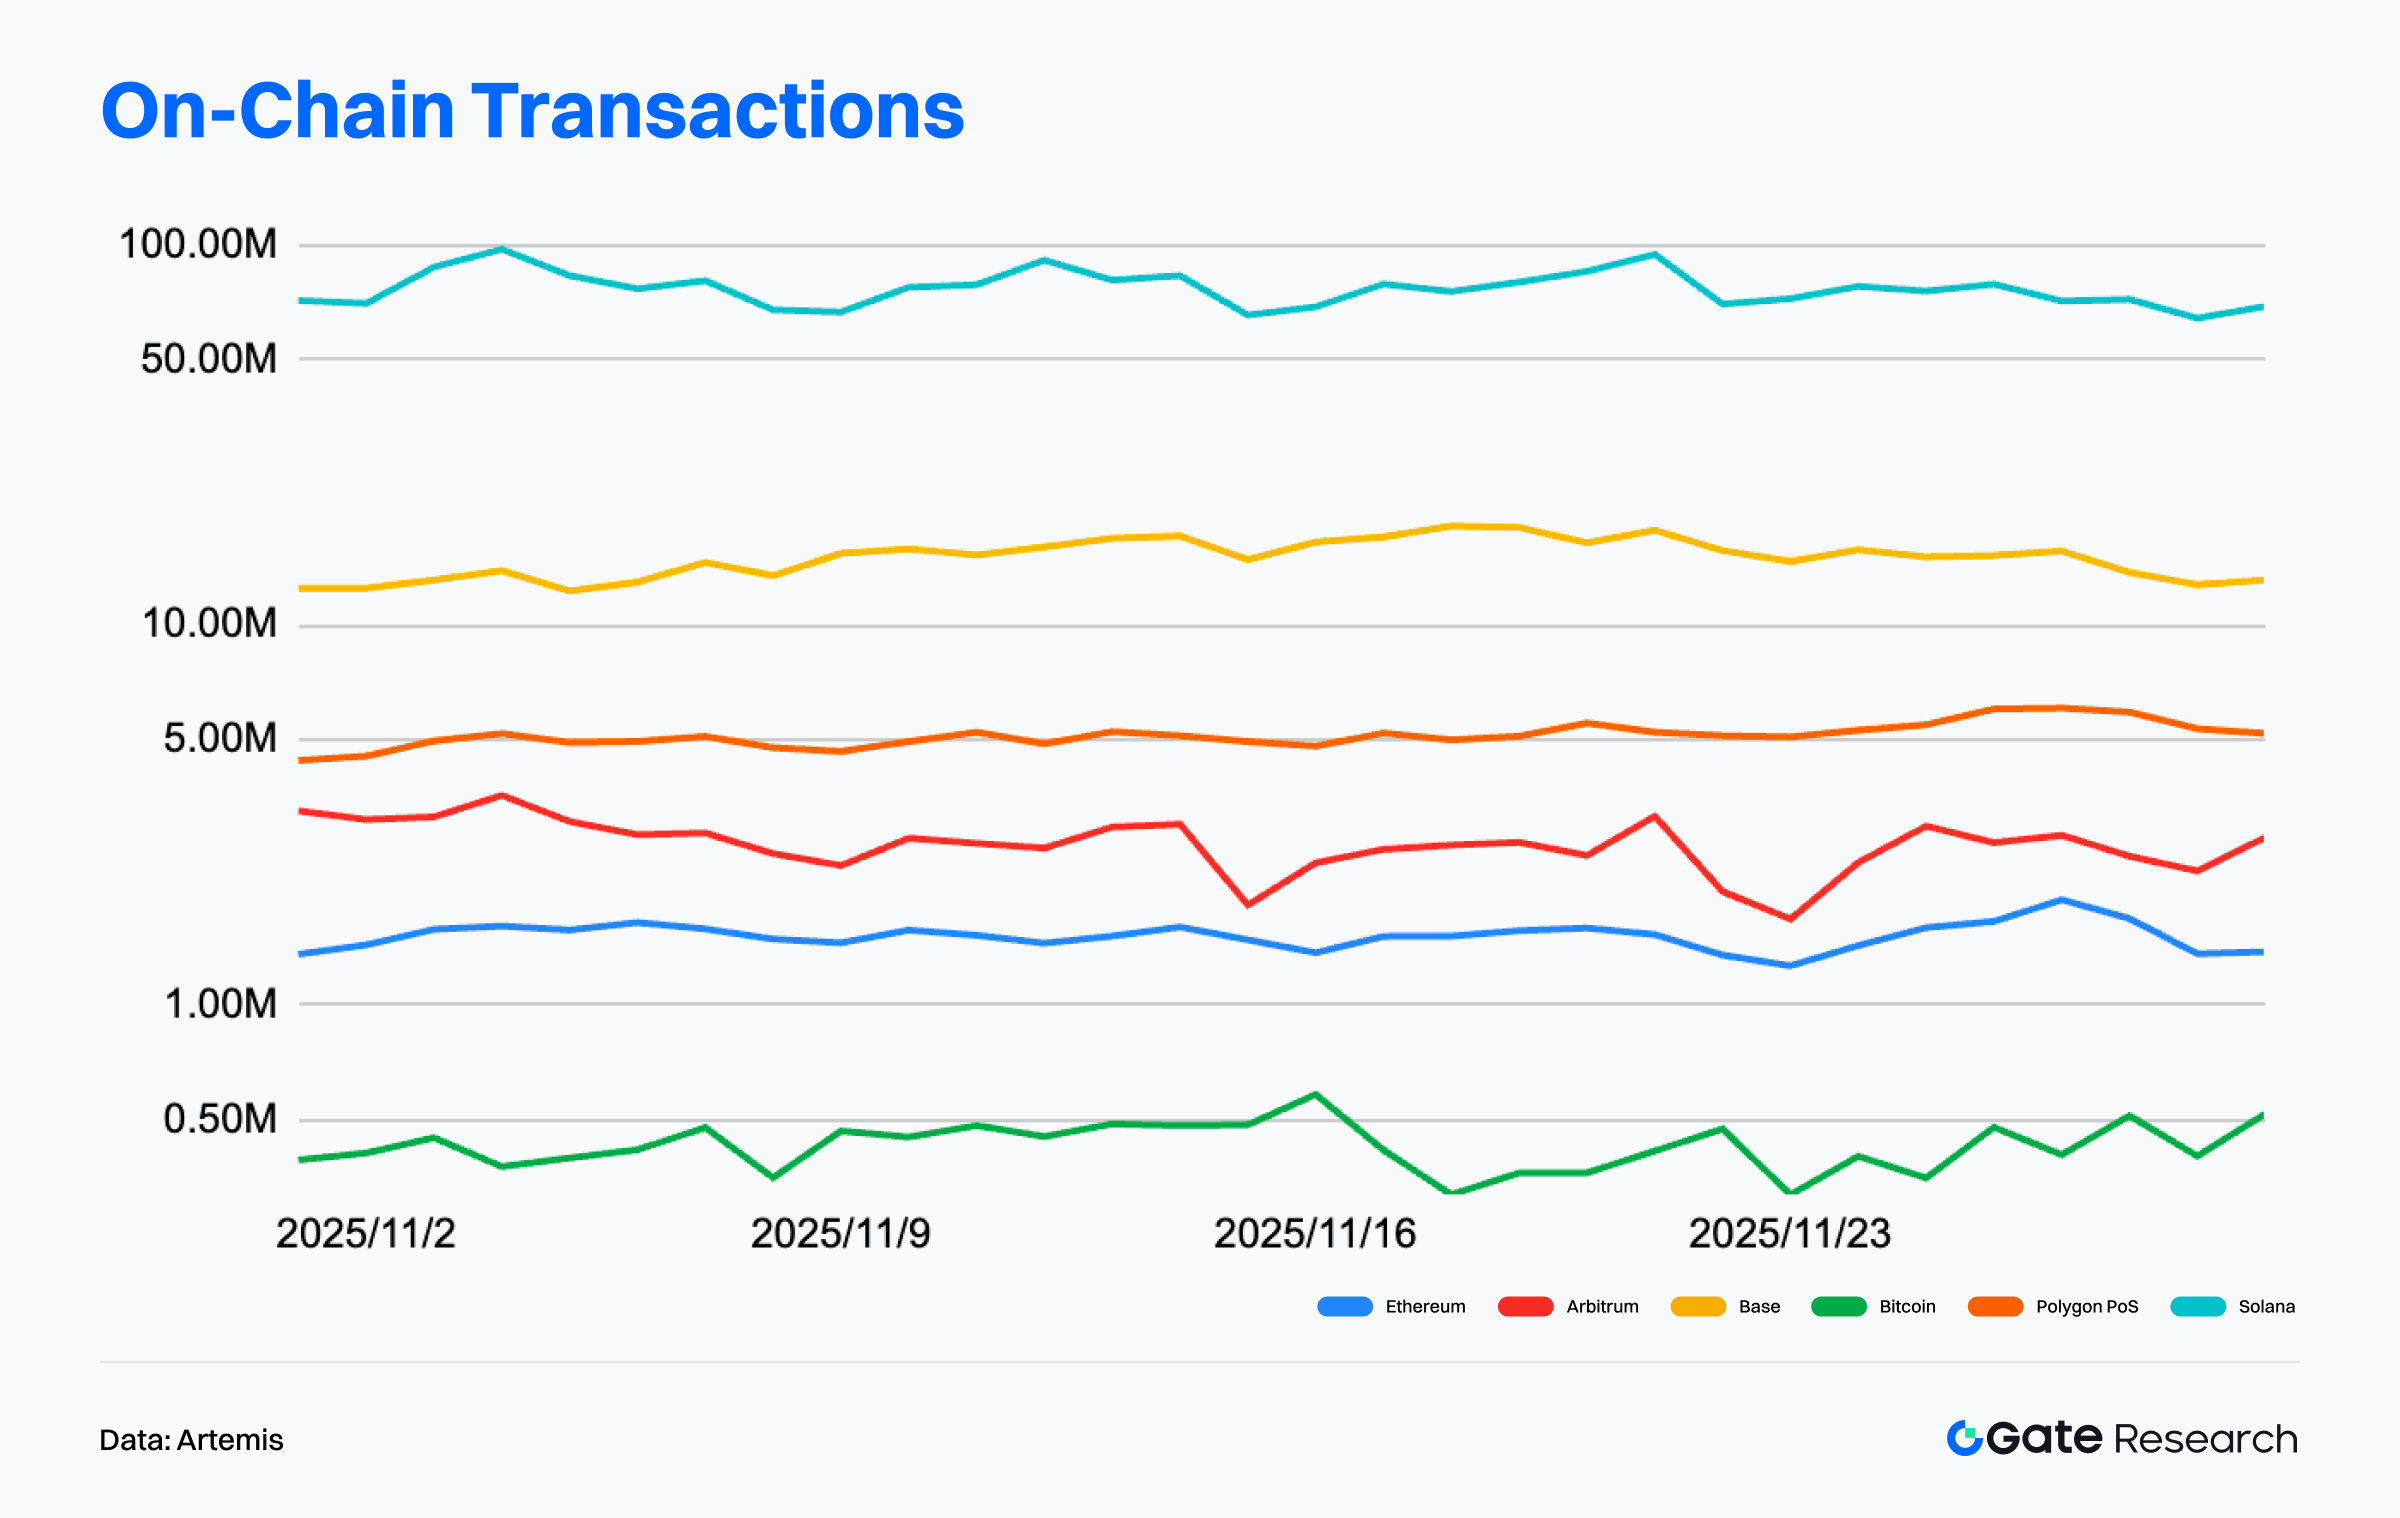
According to Artemis data, on-chain activity across several major networks in November trended modestly higher, showing a structural pattern where high-performance chains lead while Layer 2 networks gradually recover. Solana maintained a clear and persistent lead throughout the month, with daily transactions mostly in the 70–100 million range and repeated spikes in mid- and late-November. This reflects strong support from its high-frequency interaction applications and stable usage even amid broader market volatility.【1】
Base showed a gentle upward trajectory, with transaction volume rising from roughly 10 million in September to the 12–14 million range in November. The month’s activity remained structurally steady, indicating consistent interaction demand driven by its social and lightweight application ecosystem. In contrast, Arbitrum exhibited typical sideways movement over the past three months, fluctuating repeatedly between 2.5–4.5 million transactions without forming a sustained upward trend. From a mid-term perspective, Arbitrum did not exhibit the “continuous recovery” or “significant rebound” often implied in market narratives; instead, it more closely reflected stable but non-expanding activity.
Overall, the last three months show the following patterns: Solana continues to anchor the high-activity segment; Base maintains a mild uptrend with ongoing ecosystem expansion; Layer 2 activity remains stratified, with Base improving structurally while Arbitrum sits in a “stable but not expanding” zone. Market observers should avoid overinterpreting Arbitrum’s short-term fluctuations as trend reversals.
Active Address Analysis: Solana Dominates; Arbitrum Remains in Low-Level Volatility
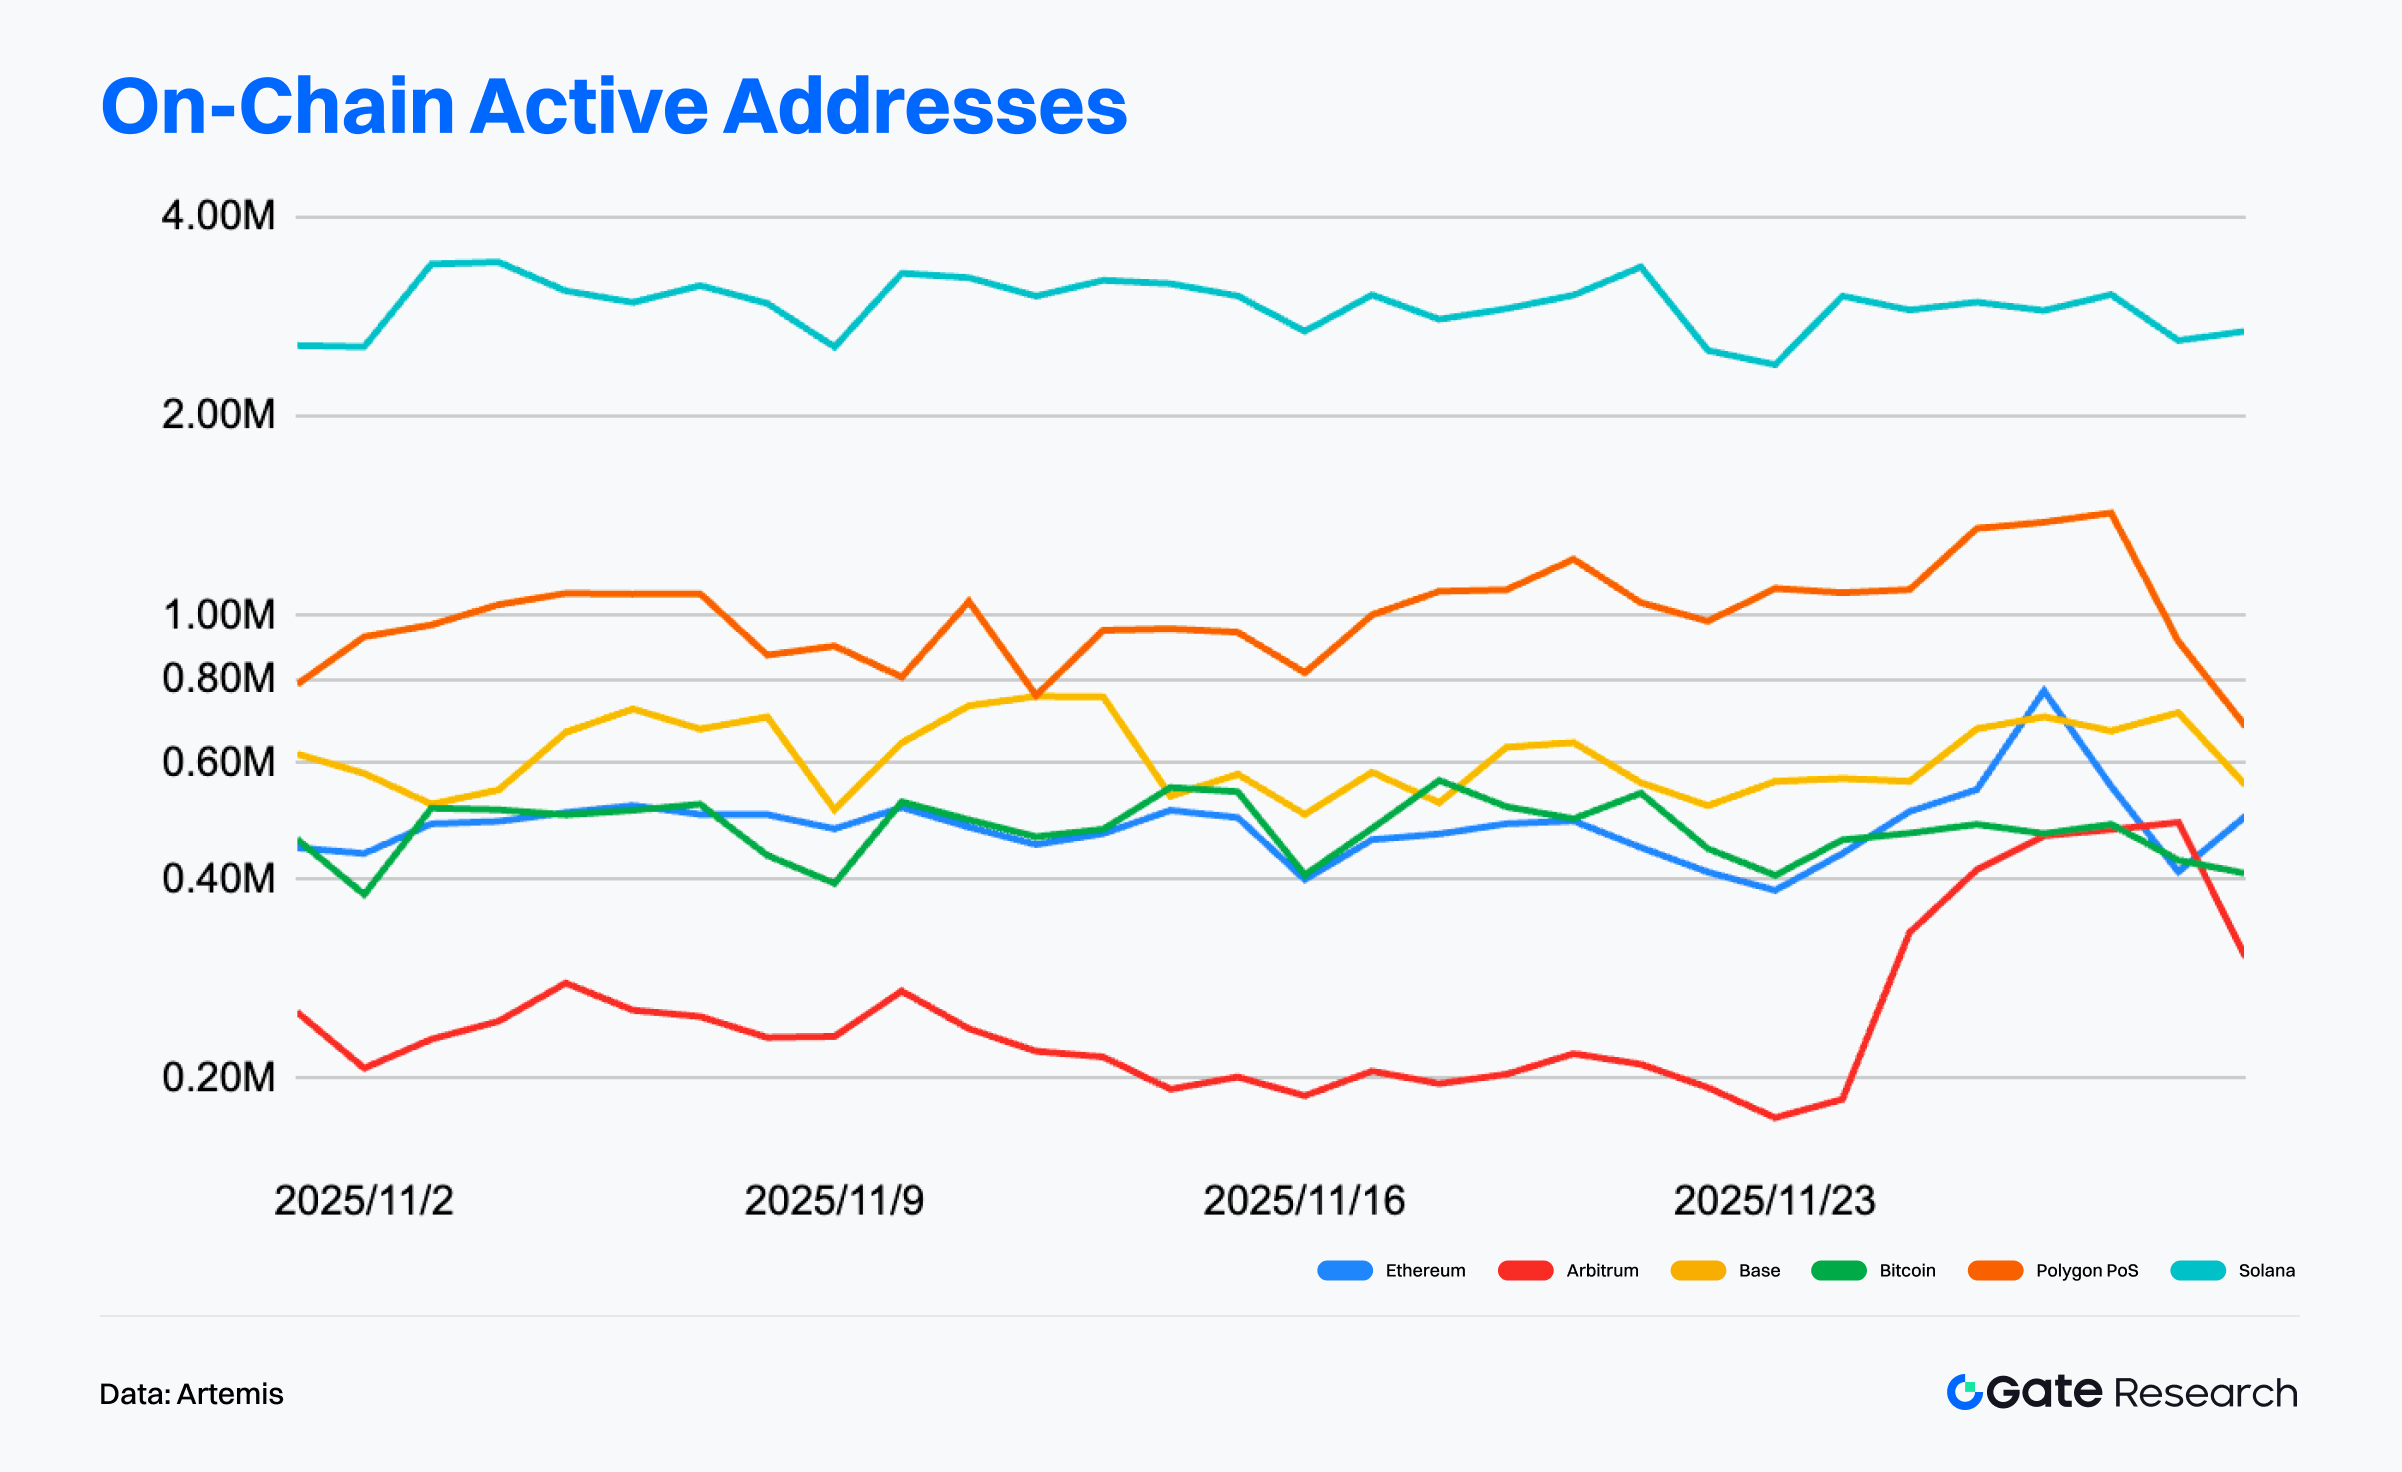
Artemis data shows that active addresses across major chains in November remained broadly stable, though structural differences became more pronounced. Solana led significantly with 2.5–3.5 million daily active addresses, maintaining high levels despite cyclical swings, reflecting strong ecosystem stickiness and high-frequency usage.【2】
Polygon PoS remained steady, mostly in the 800,000–1.2 million range, briefly exceeding 1.3 million at month-end—making it the second-most active chain after Solana. Base ranked next, with 550,000–750,000 daily active users, showing stable structure driven by its social and lightweight app ecosystem. Arbitrum, however, saw more notable weakness: active addresses declined from 250,000–300,000 at the start of the month to 180,000–200,000 mid-month, followed by a mild rebound but remaining in a low-level consolidation range. This indicates that user activity partially rotated toward ecosystems such as Base and Polygon.
In summary, November’s on-chain activity exhibited clear stratification: Solana dominates high-frequency interaction scenarios; Polygon PoS maintains a stable and expanding user base above Base; Ethereum and Bitcoin continue to serve as stable settlement layers without major expansion; Arbitrum saw an evident drop in activity, reflecting a cooling of certain Layer 2 ecosystems. High-performance chains lead interaction volume, mid-tier chains expand steadily, and some Layer 2s enter correction phases.
On-Chain Fee/Revenue: Ethereum and Solana Lead; Base Shows Increased Volatility
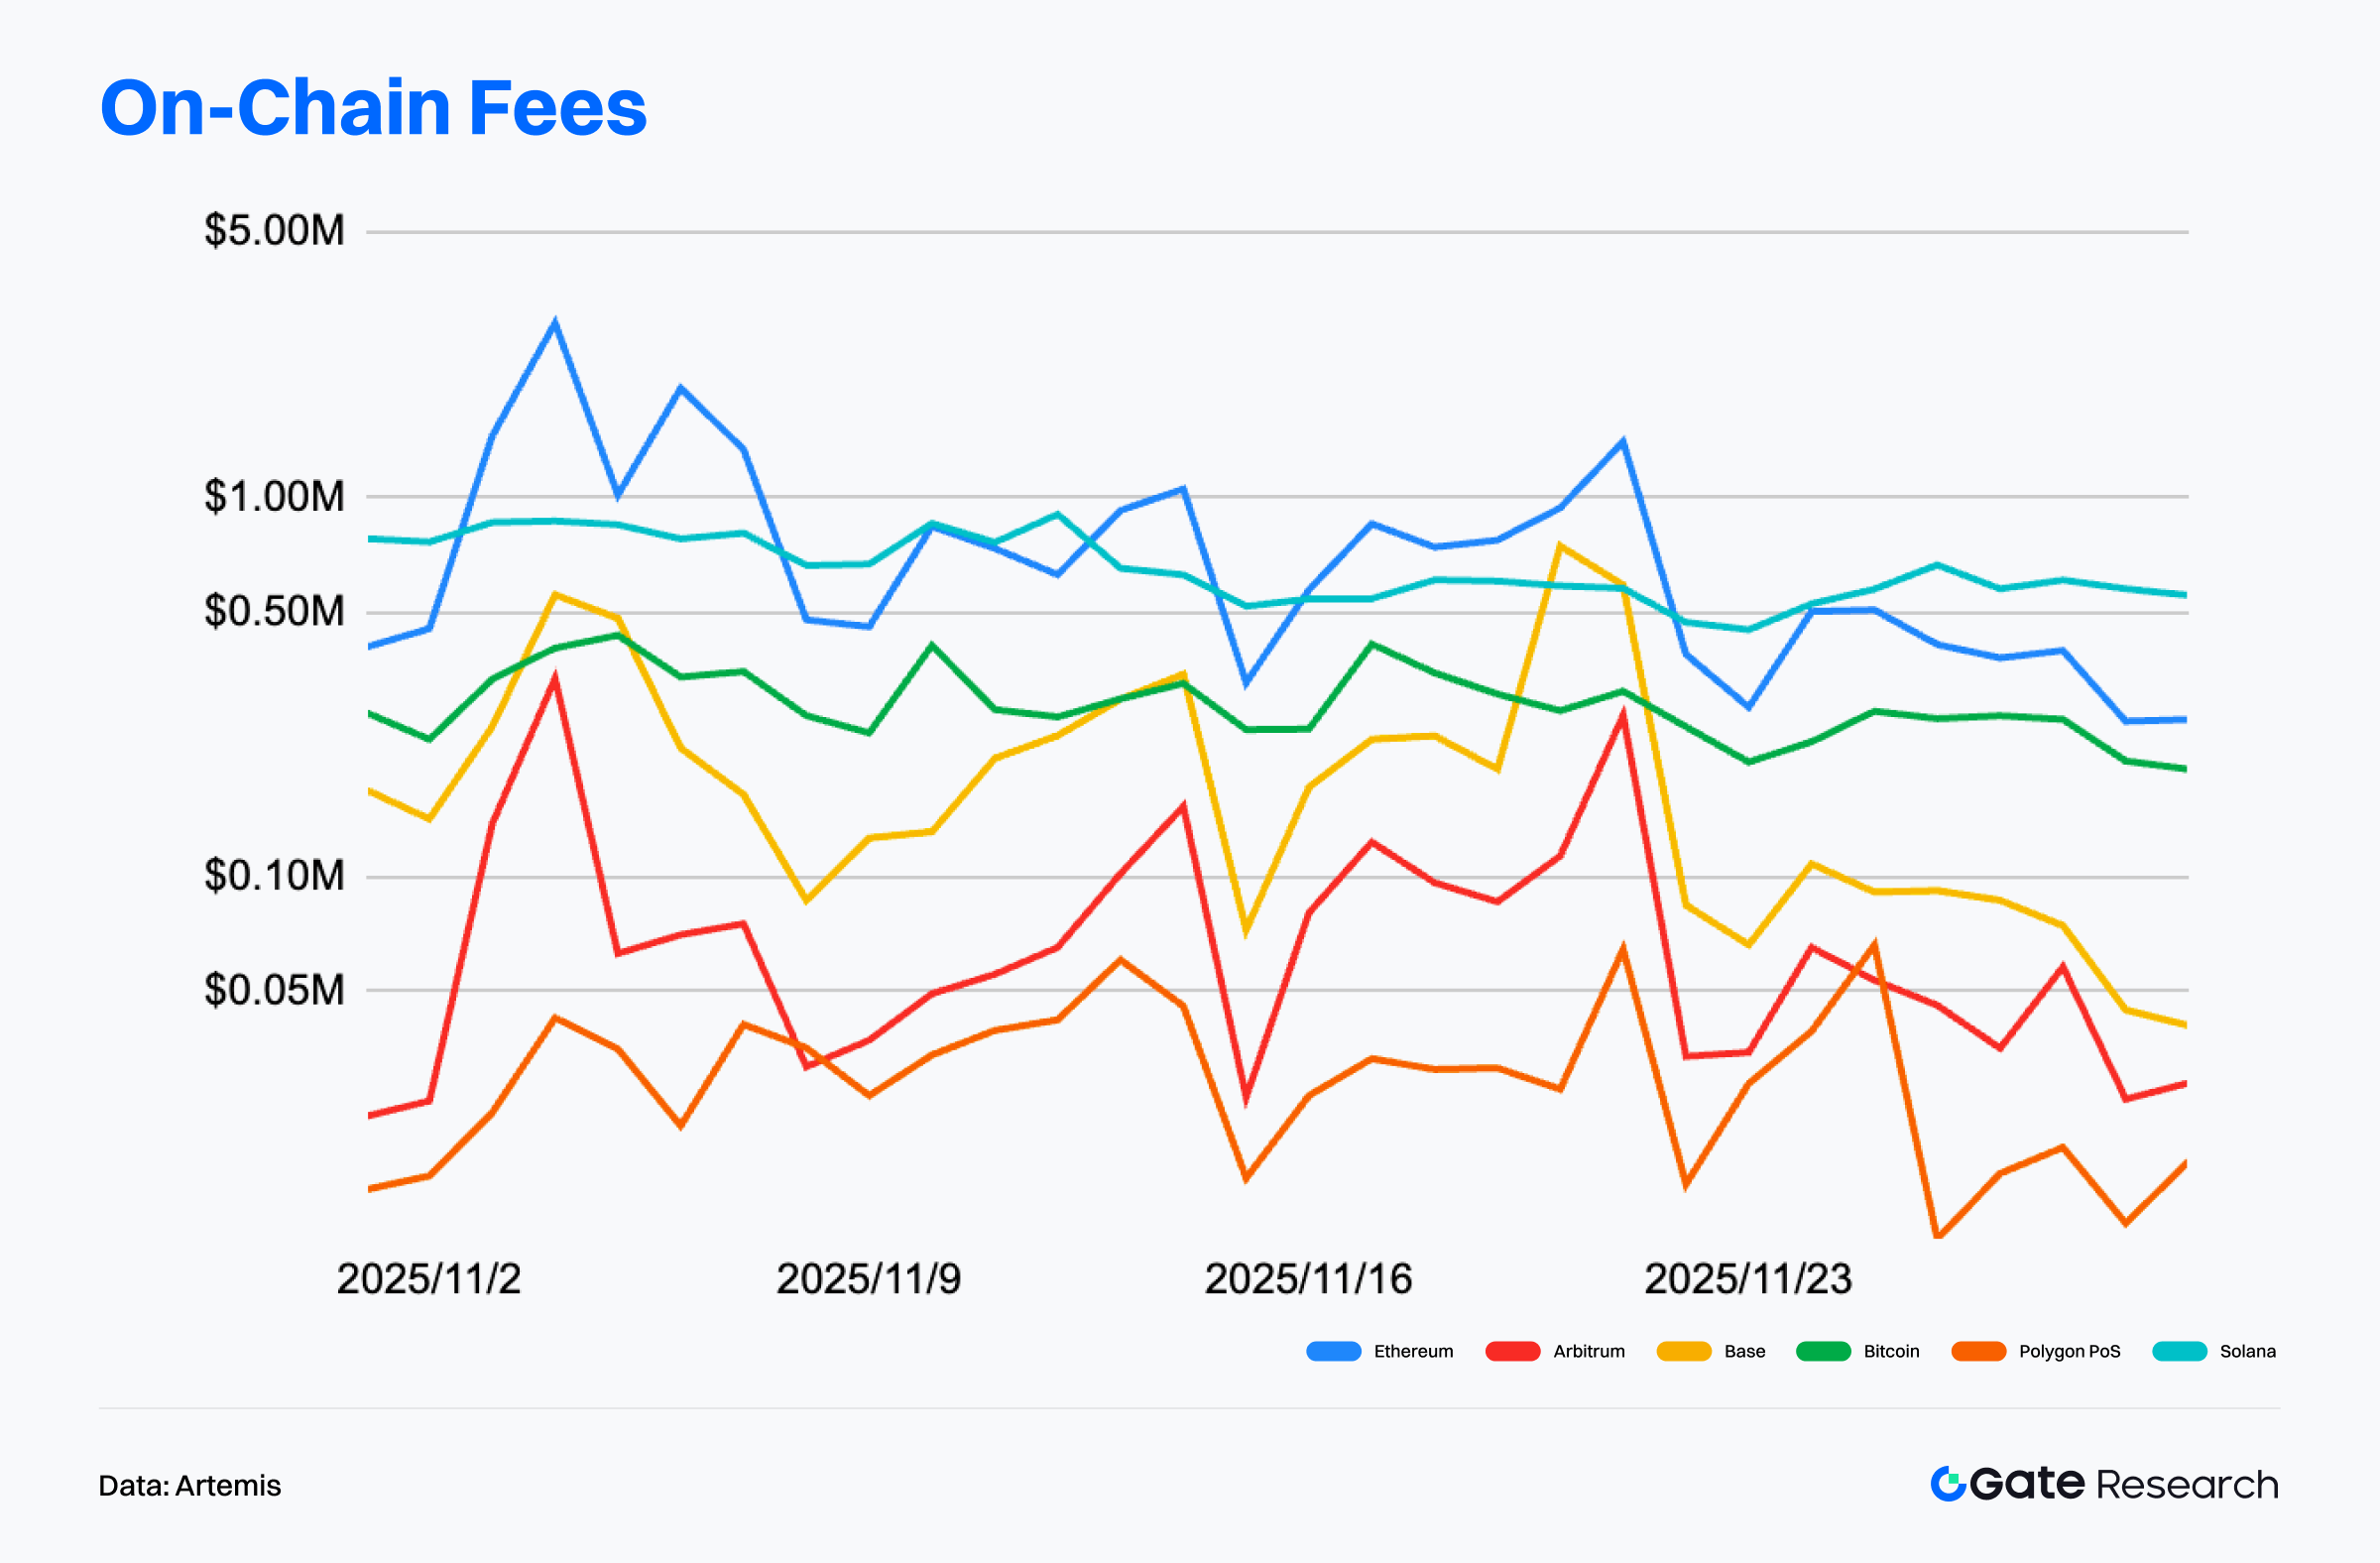
Artemis data indicates that November’s fee revenue across major chains showed a structural pattern where high-value networks maintained leadership while mid-tier chains weakened. Ethereum’s fee revenue stood well above all other networks, typically ranging between $500,000 and 1.5 million per day, with three notable peaks throughout the month. Fee composition remained dominated by DeFi settlements, high-value transfers, and contract interactions, reinforcing Ethereum’s status as the economic center of the blockchain ecosystem.【3】
Solana remained firmly in the second tier, with daily fees clustering around $800,000–1 million. Its relatively limited volatility reflects steady contributions from high-frequency trading, DEX activity, and ecosystem interactions, even amid market sentiment shifts. Compared with these two networks, Base exhibited more notable volatility: daily fees repeatedly rose from below $100,000 to $400,000–600,000, and even surpassed $700,000 at month-end. This suggests that certain protocols or activity bursts within Base can temporarily drive large fee spikes.
Overall, November’s fee structure shows clear stratification: Ethereum and Solana maintain stable leadership; Base exhibits volatile but episodically strong activity; Polygon and Arbitrum remain in a low-fee environment. Total fee revenue has not shown sustained expansion, implying that in a low-volatility market, on-chain economic activity relies more on event-driven spikes rather than structural growth.
Divergent Capital Flows Across Public Chains: Arbitrum Leads; Starknet and BTCFi Narratives Rise
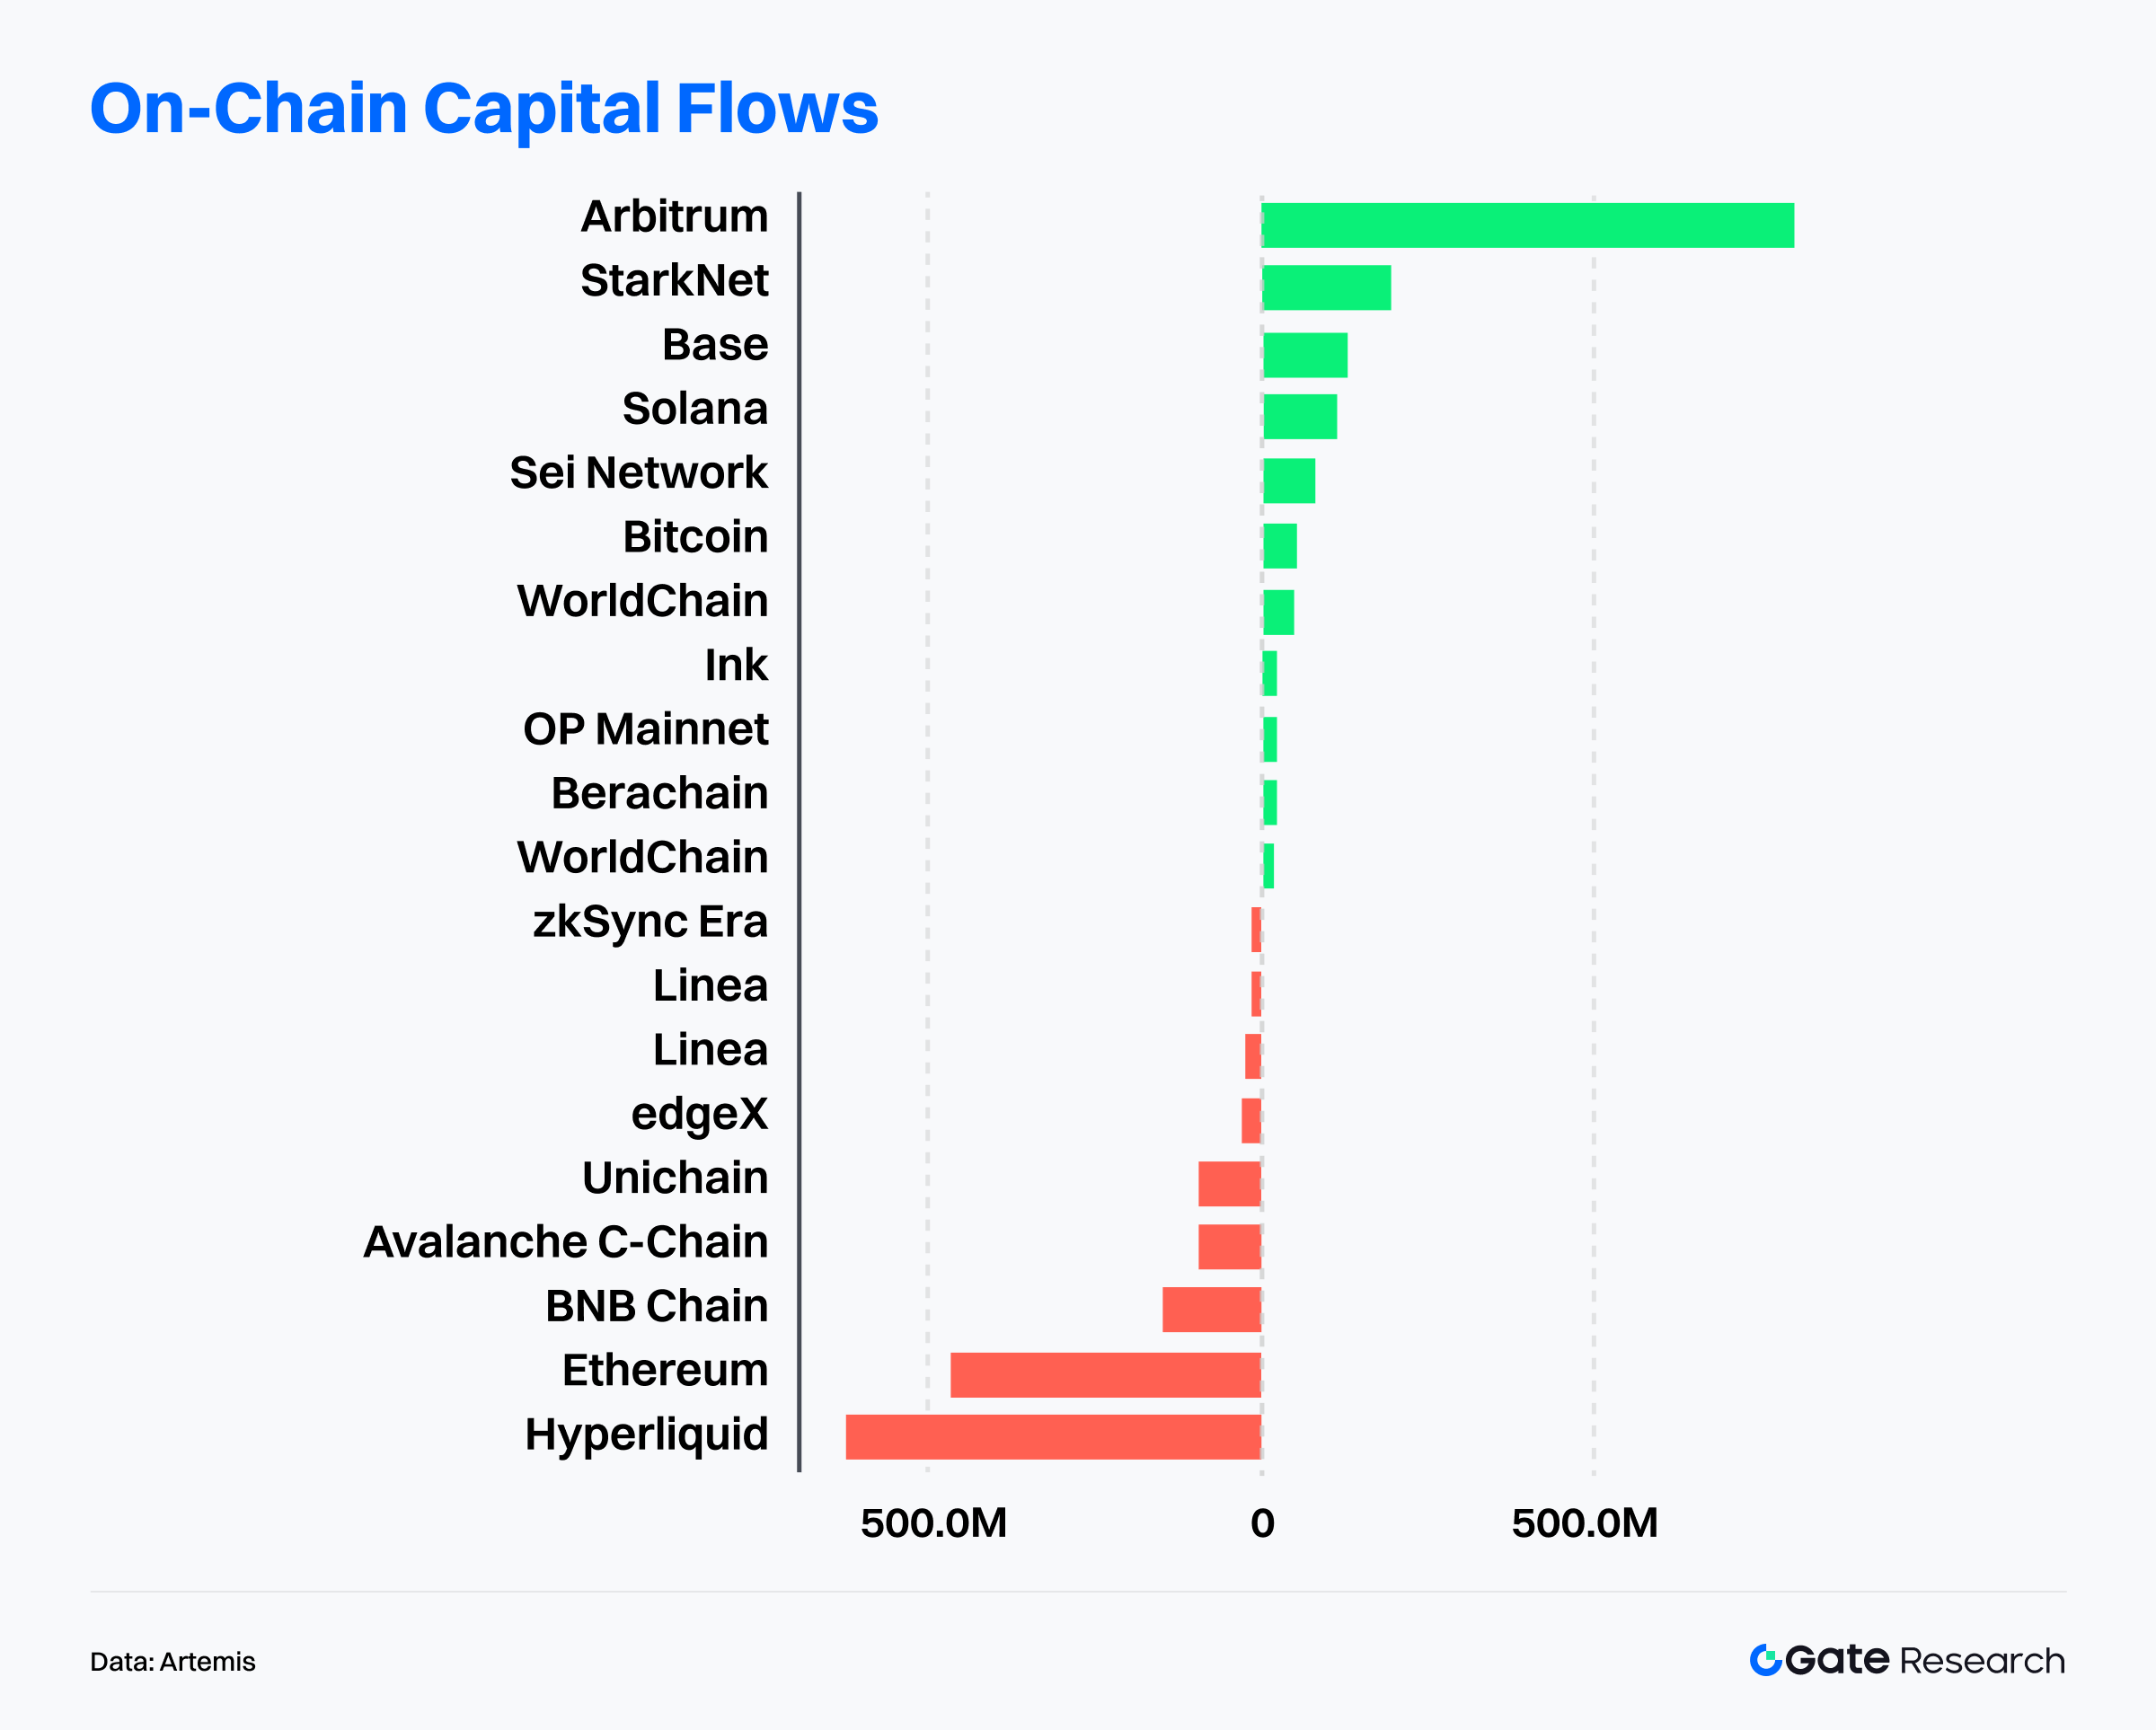
Artemis data shows significant divergence in on-chain capital flows over the past month: high-growth Layer 2 networks and emerging chains continued attracting inflows, while some previously high-valuation ecosystems recorded notable outflows. Arbitrum topped all chains by a wide margin in net inflows, reflecting advantages in sustained incentives, institutional participation, and expansion of its financial infrastructure. Starknet, Base, Solana, and SEI also recorded positive inflows, showing market preference for ecosystems with expansion potential and strong narratives.【4】
Arbitrum’s capital appeal stems from developments on multiple fronts:
- Robinhood selected it as the core issuance layer for regulated security tokenization, with on-chain tokenized assets nearing $10 million and forming authentic trading cycles.
- Institutional-grade infrastructure such as Deblock, BlockControl, and Hermes has been deployed intensively, upgrading Arbitrum from a “DeFi chain” to a cross-chain liquidity and settlement hub.
- USDC and USDT supplies increased, cross-chain bridge ETH reserves reached new highs, and fund-bearing capacity continued to strengthen.
Starknet also performed strongly under the rising BTCFi narrative:
- BTC staking expanded rapidly with multiple BTC asset pathways launching, positioning Starknet as a “Bitcoin yield layer.”
- Over 1 billion STRK is now staked, improving network security and the stability of its economic model.
- Both DeFi and consumer-facing applications grew in parallel, with account-abstraction-based use cases helping user numbers surpass one million.
In contrast, ecosystems such as Hyperliquid, Ethereum mainnet, BNB Chain, and Avalanche saw substantial net outflows, suggesting capital rotation away from high-valuation networks toward ecosystems with greater growth elasticity and stronger narratives. Overall, the market has entered a phase of “structural rotation + risk repricing,” with capital concentrated in networks offering established narratives, steady user growth, and scalable expansion prospects.
Bitcoin Key Metrics Analysis
In November, the crypto market accelerated to the downside as excessive leverage unwound, closing the month down 17.5%—the largest monthly pullback this year—with risk assets broadly under pressure. Amid weakening macroeconomic data and increasingly dovish signals from the Federal Reserve, the probability of a rate cut in December has risen above 80%. Although BTC and ETH reclaimed USD 90,000 and USD 3,000 last week, respectively, trading volumes contracted notably, indicating limited strength behind the rebound. Institutional sentiment remains cautious, spot Bitcoin ETF inflows are weak, and structural demand continues to hover at subdued levels.
Within this environment, on-chain data provides more structural signals: BTC remains above several key realized price cost bases, and overall risk indicators stay in a neutral-to-constructive range, suggesting that the primary trend has not been broken. However, dense supply zones above current prices continue to pose short-term resistance. Meanwhile, realized-loss metrics have risen sharply, indicating a phase of emotional cleansing and overhead supply pressure, with short-term capital still exhibiting cautious buy-side behavior. Over longer horizons, long-term holder profitability is declining alongside emerging net distribution, suggesting that early cohorts have begun realizing gains, with market dynamics shifting from momentum-driven expansion toward trend rotation and cyclical cooling.
BTC Falls Below Short-Term and Active Investor Cost Bases, Risk Indicators Shift Toward Neutral-Weak
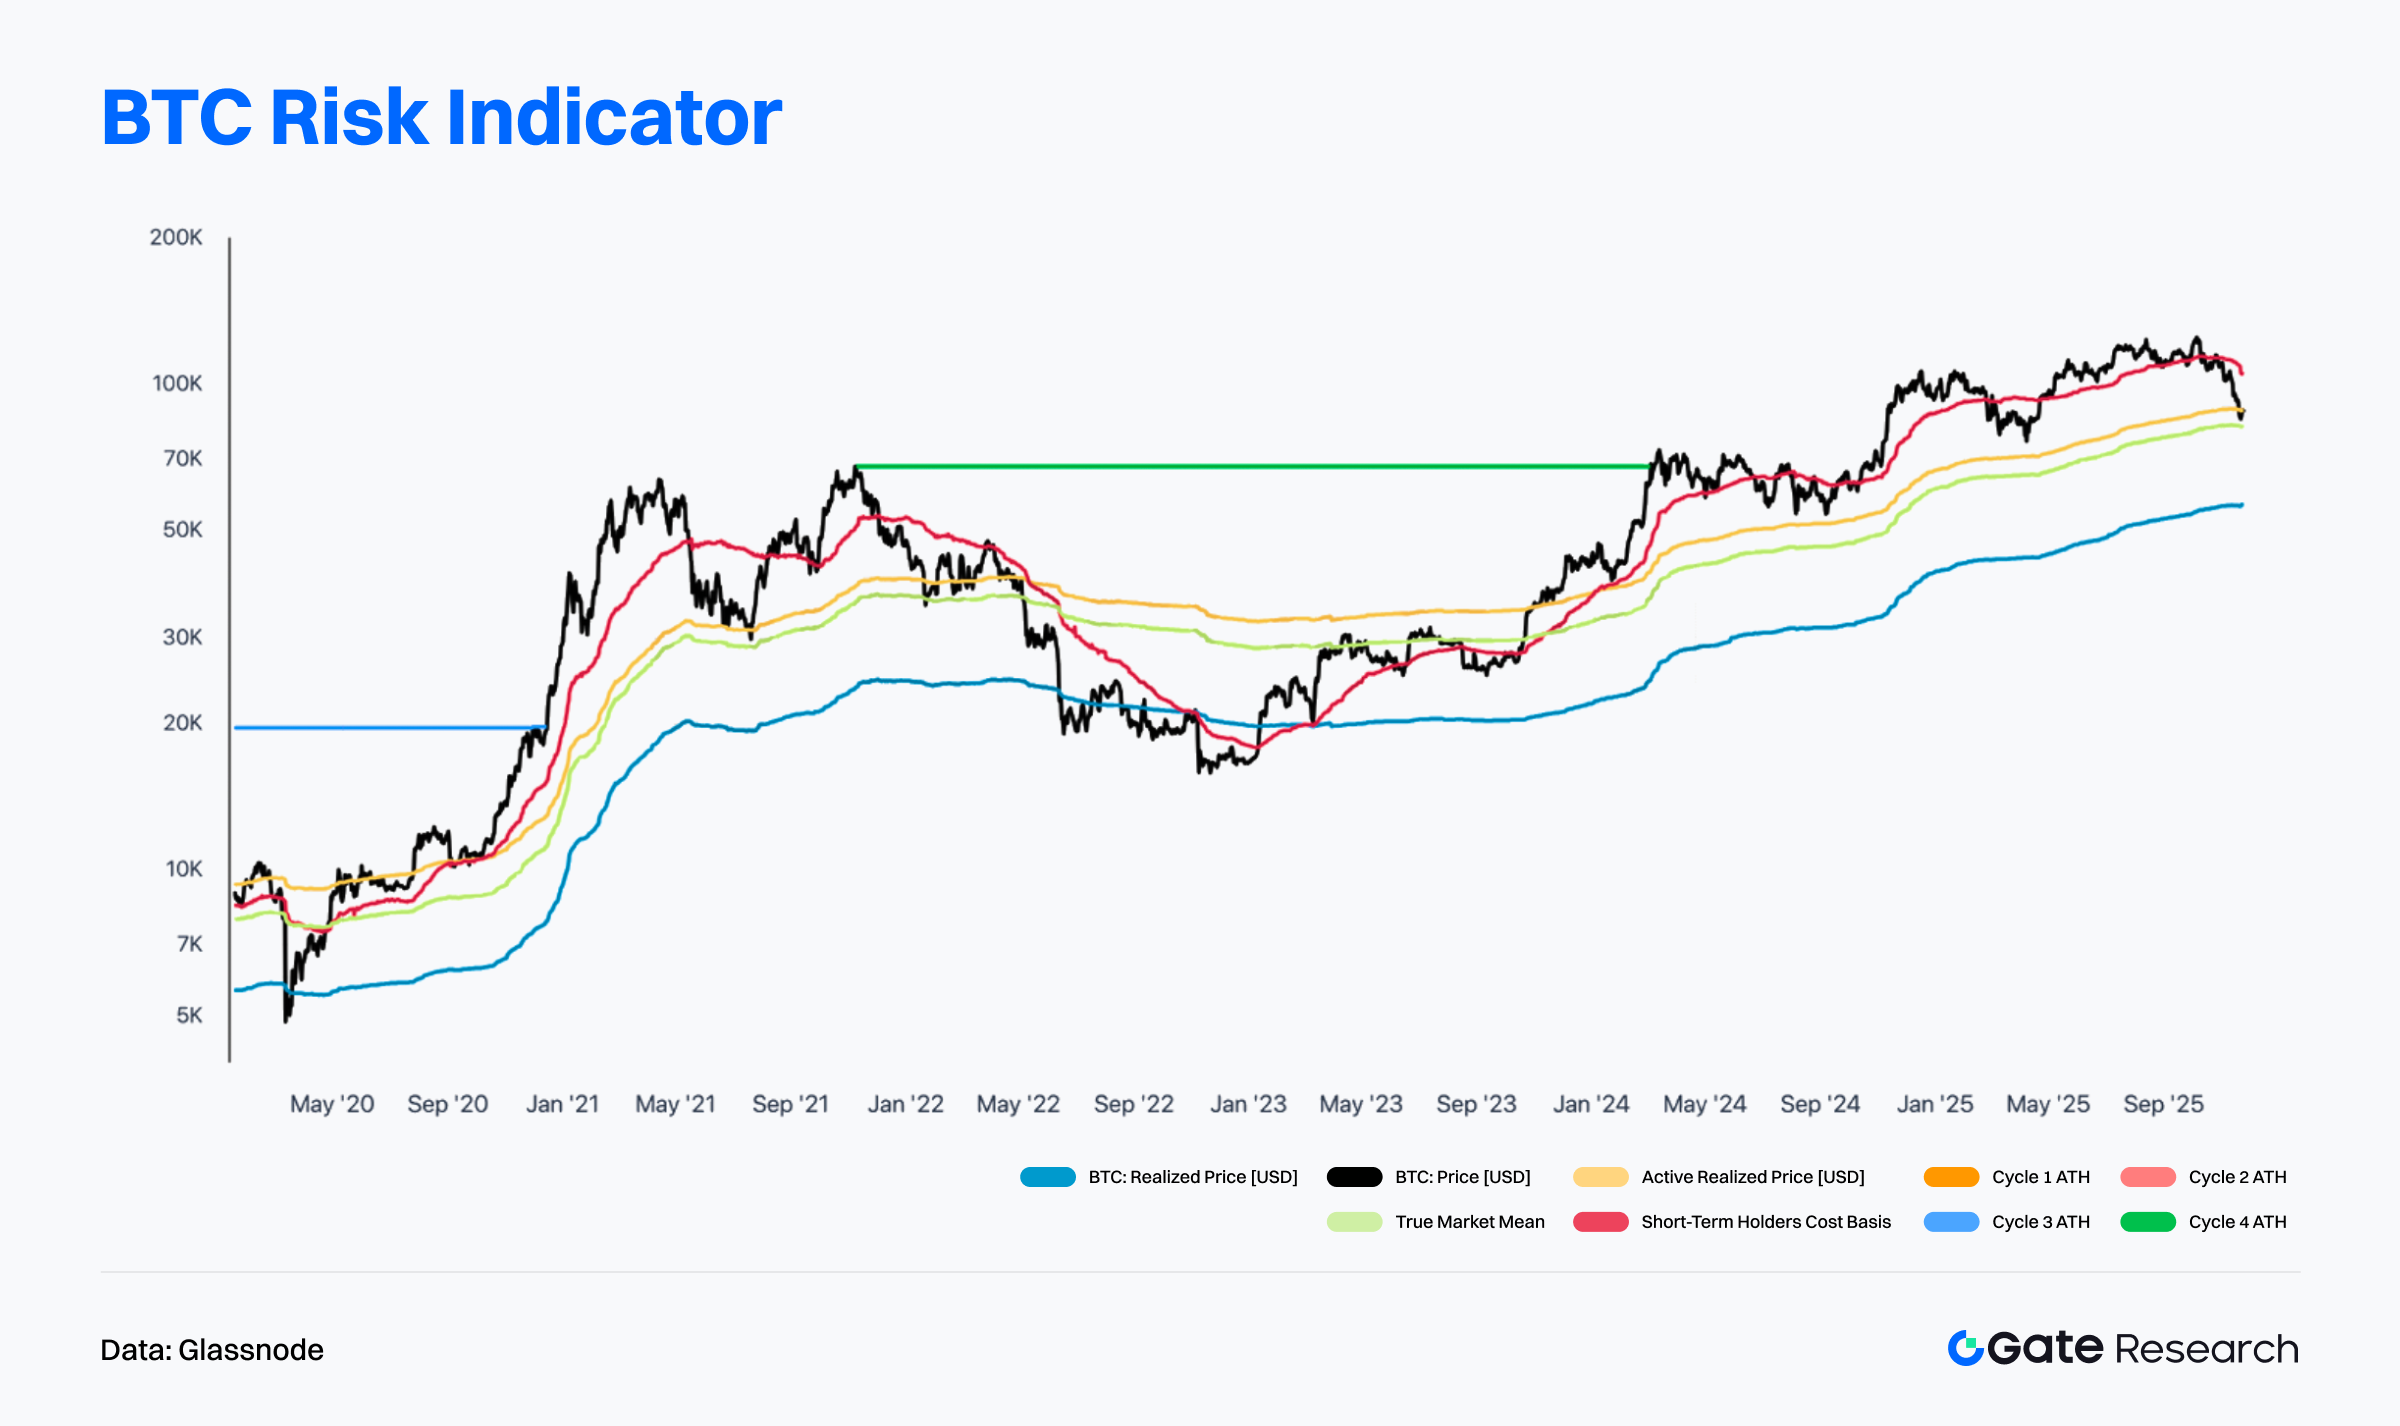
According to Glassnode data, BTC has recently fallen below both the Short-Term Holder Realized Price (STH Realized Price) and the Active Investor Mean, placing short-term holders back into an unrealized-loss position and shifting market sentiment from neutral-strong to neutral-weak. The short-term support zone formed by these yellow and red cost lines has been decisively broken, indicating weakening near-term buy-side momentum and a transition into a pressure-dominated market structure.【6】
Although BTC remains above the Realized Price and the True Market Mean, the gap between them is narrowing, suggesting that momentum has moved from an expansion phase toward a digestion and rotation period. If price continues to trade below the Active Investor Mean, short-term risk appetite may contract further, drawing the market toward the True Market Mean or Realized Price levels.
Multi-cycle ATH cost bases remain above spot, indicating that the broader long-term structure is intact and BTC continues to operate within a macro bull-market framework. However, with short-term cost lines now breached, the market is more likely to evolve into a high-level consolidation and redistribution phase. A sustained recovery above the STH Realized Price would help restore near-term strength; failure to do so may increase corrective pressure. Overall, the composite risk indicators suggest BTC has shifted from a neutral-strong to a neutral-weak rebalancing stage—under short-term pressure yet still maintaining an unbroken mid-term trend.
BTC Realized Losses Expand, Marking a Phase of Emotional Reset and Overhead Supply Pressure
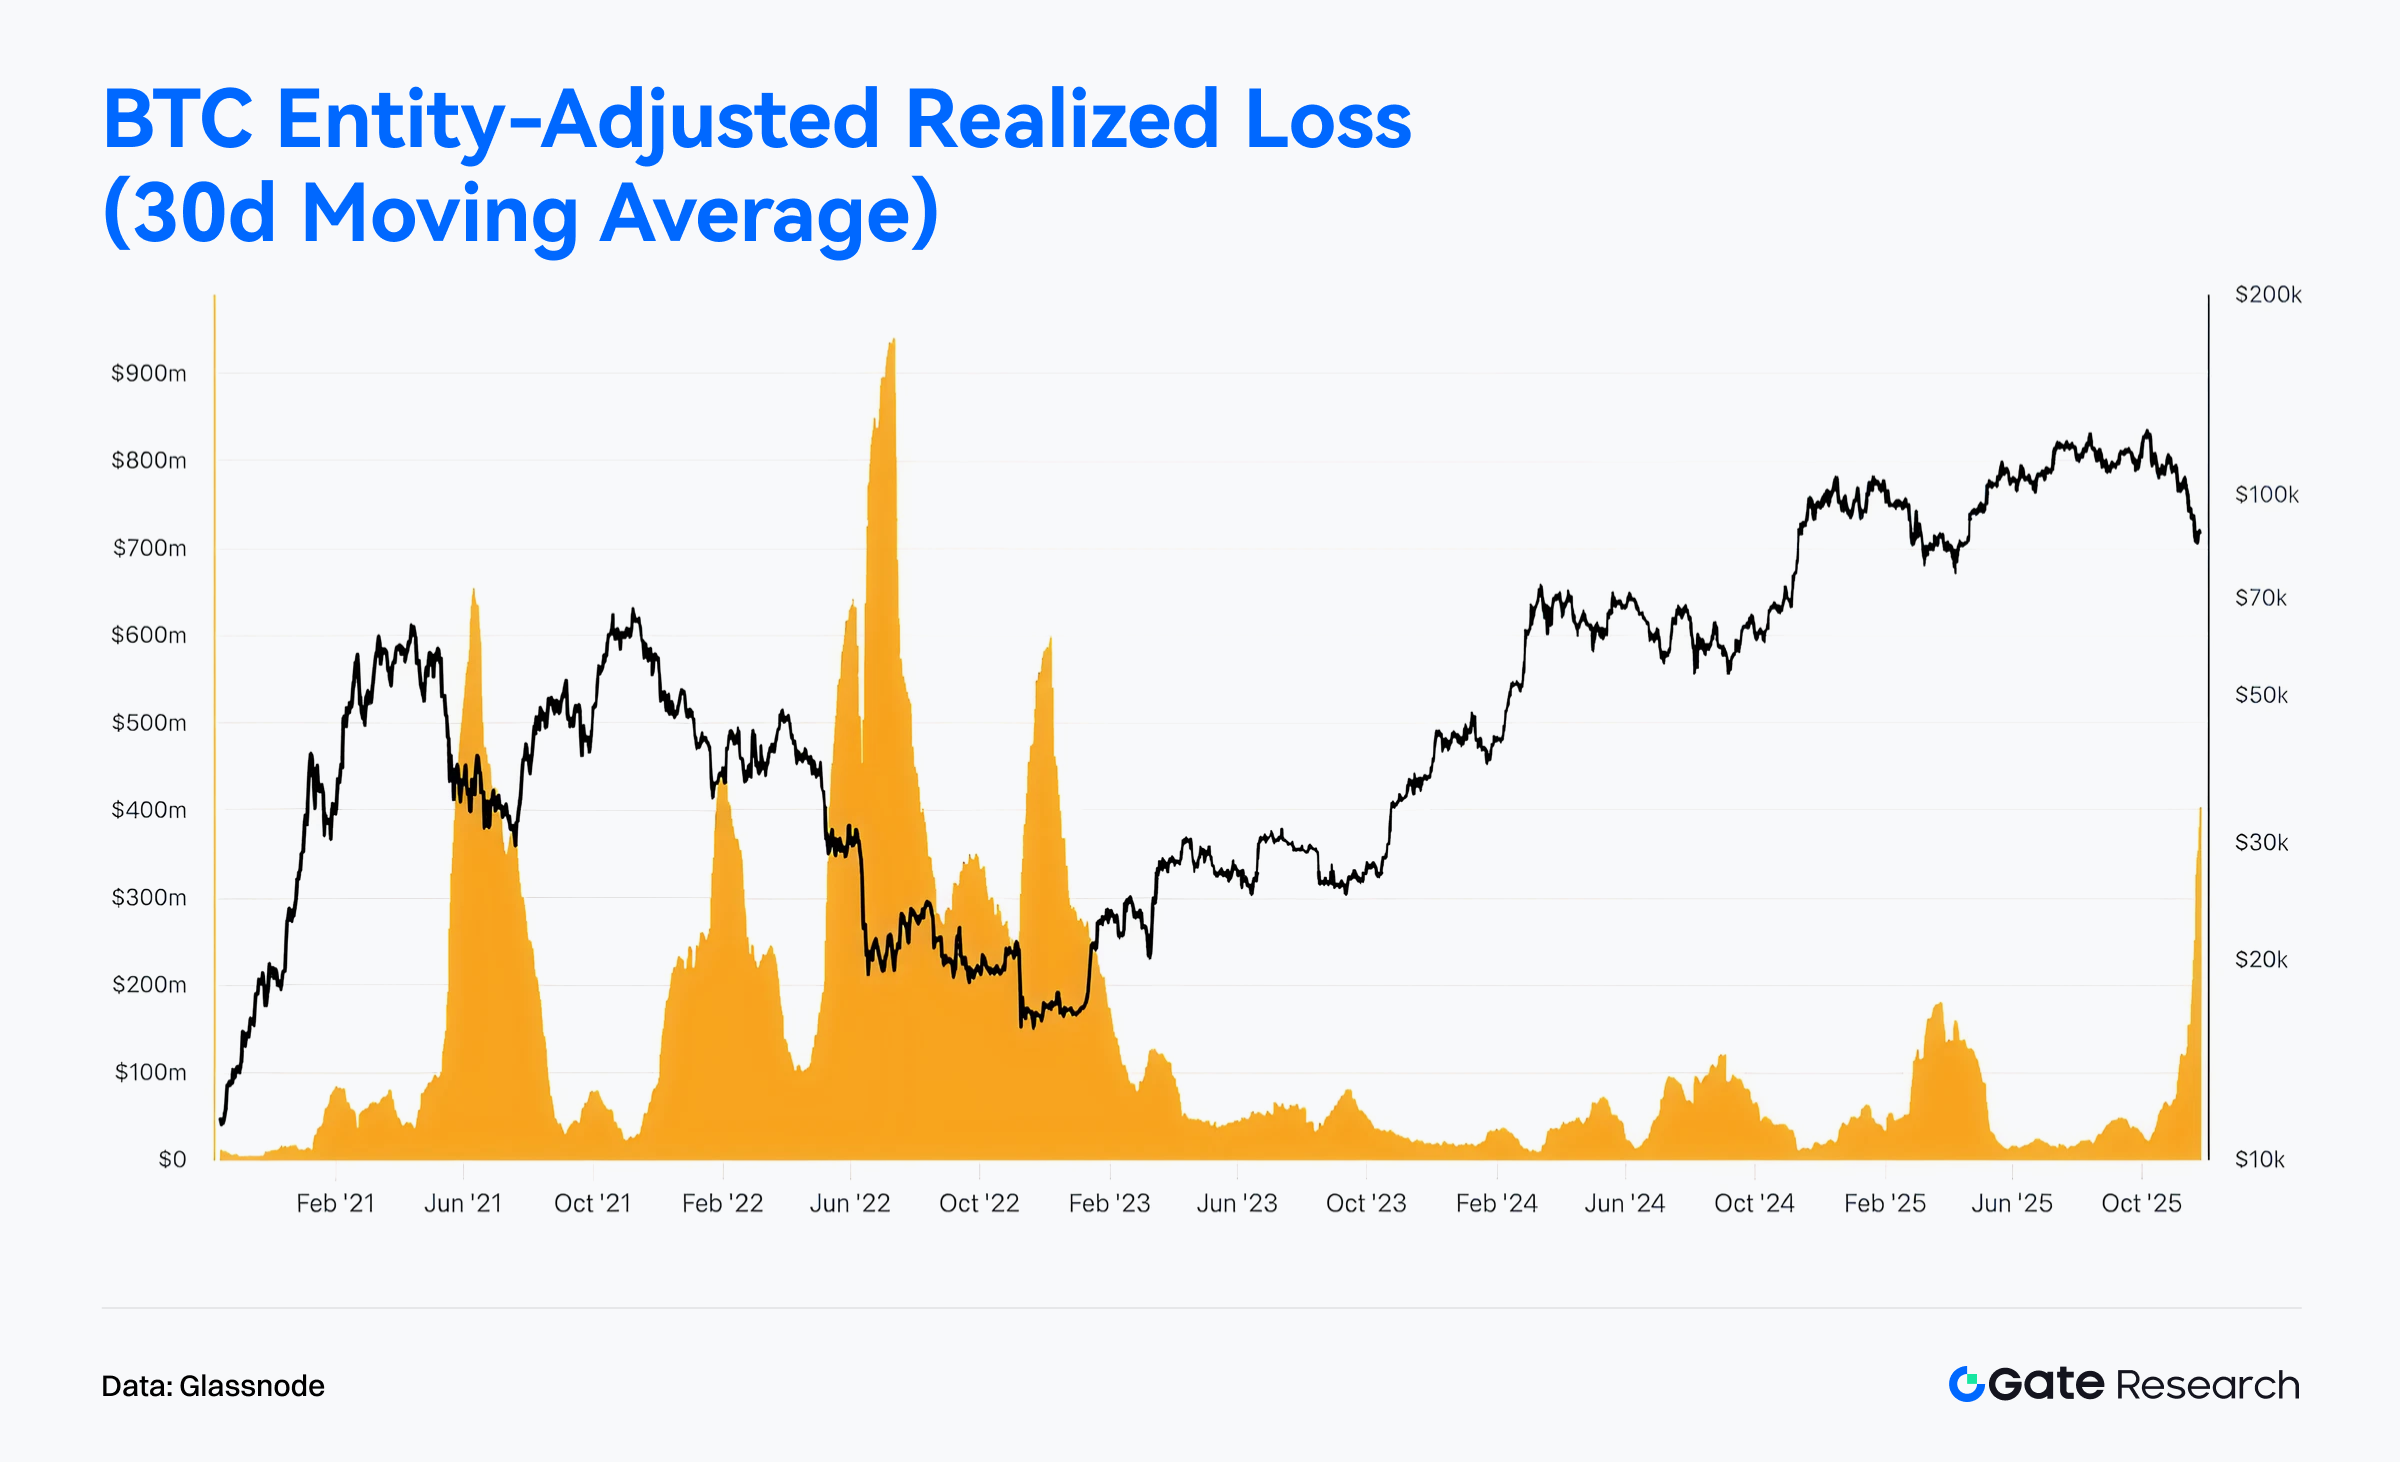
Glassnode data shows that Entity-Adjusted Realized Losses (30-day MA) rose sharply throughout November, forming a steep upward trajectory as prices drifted lower. This reflects concentrated and persistent realized losses during the recent volatility. Historically, similar surges in realized losses correspond to periods of forced deleveraging, capitulation among short-term holders, or emotionally driven selling following heightened volatility. While the current loss magnitude has not reached the extreme levels of 2021 or 2022, it is significantly elevated relative to 2023–2024 norms, suggesting the market is undergoing a short-term corrective phase where speculative positions are being unwound.【7】
Although rising realized losses imply short-term pressure, from a cyclical standpoint such loss realizations at elevated price ranges often represent a necessary risk-absorption phase within a broader uptrend. Historically, if realized losses decline rapidly within the subsequent 1–3 weeks, it typically signals that the market has completed short-term rotation, allowing price action to re-establish trend alignment. Conversely, if losses remain elevated alongside rising trading volumes, the market may face amplified sell-side pressure, pushing BTC toward deeper support levels. Overall, November’s rise in realized losses indicates heightened short-term volatility without undermining the mid-term bullish structure; it more closely resembles a constructive correction within a broader uptrend.
BTC Long-Term Holder Profitability Declines, Signaling Trend Rotation and Cyclical Cooling
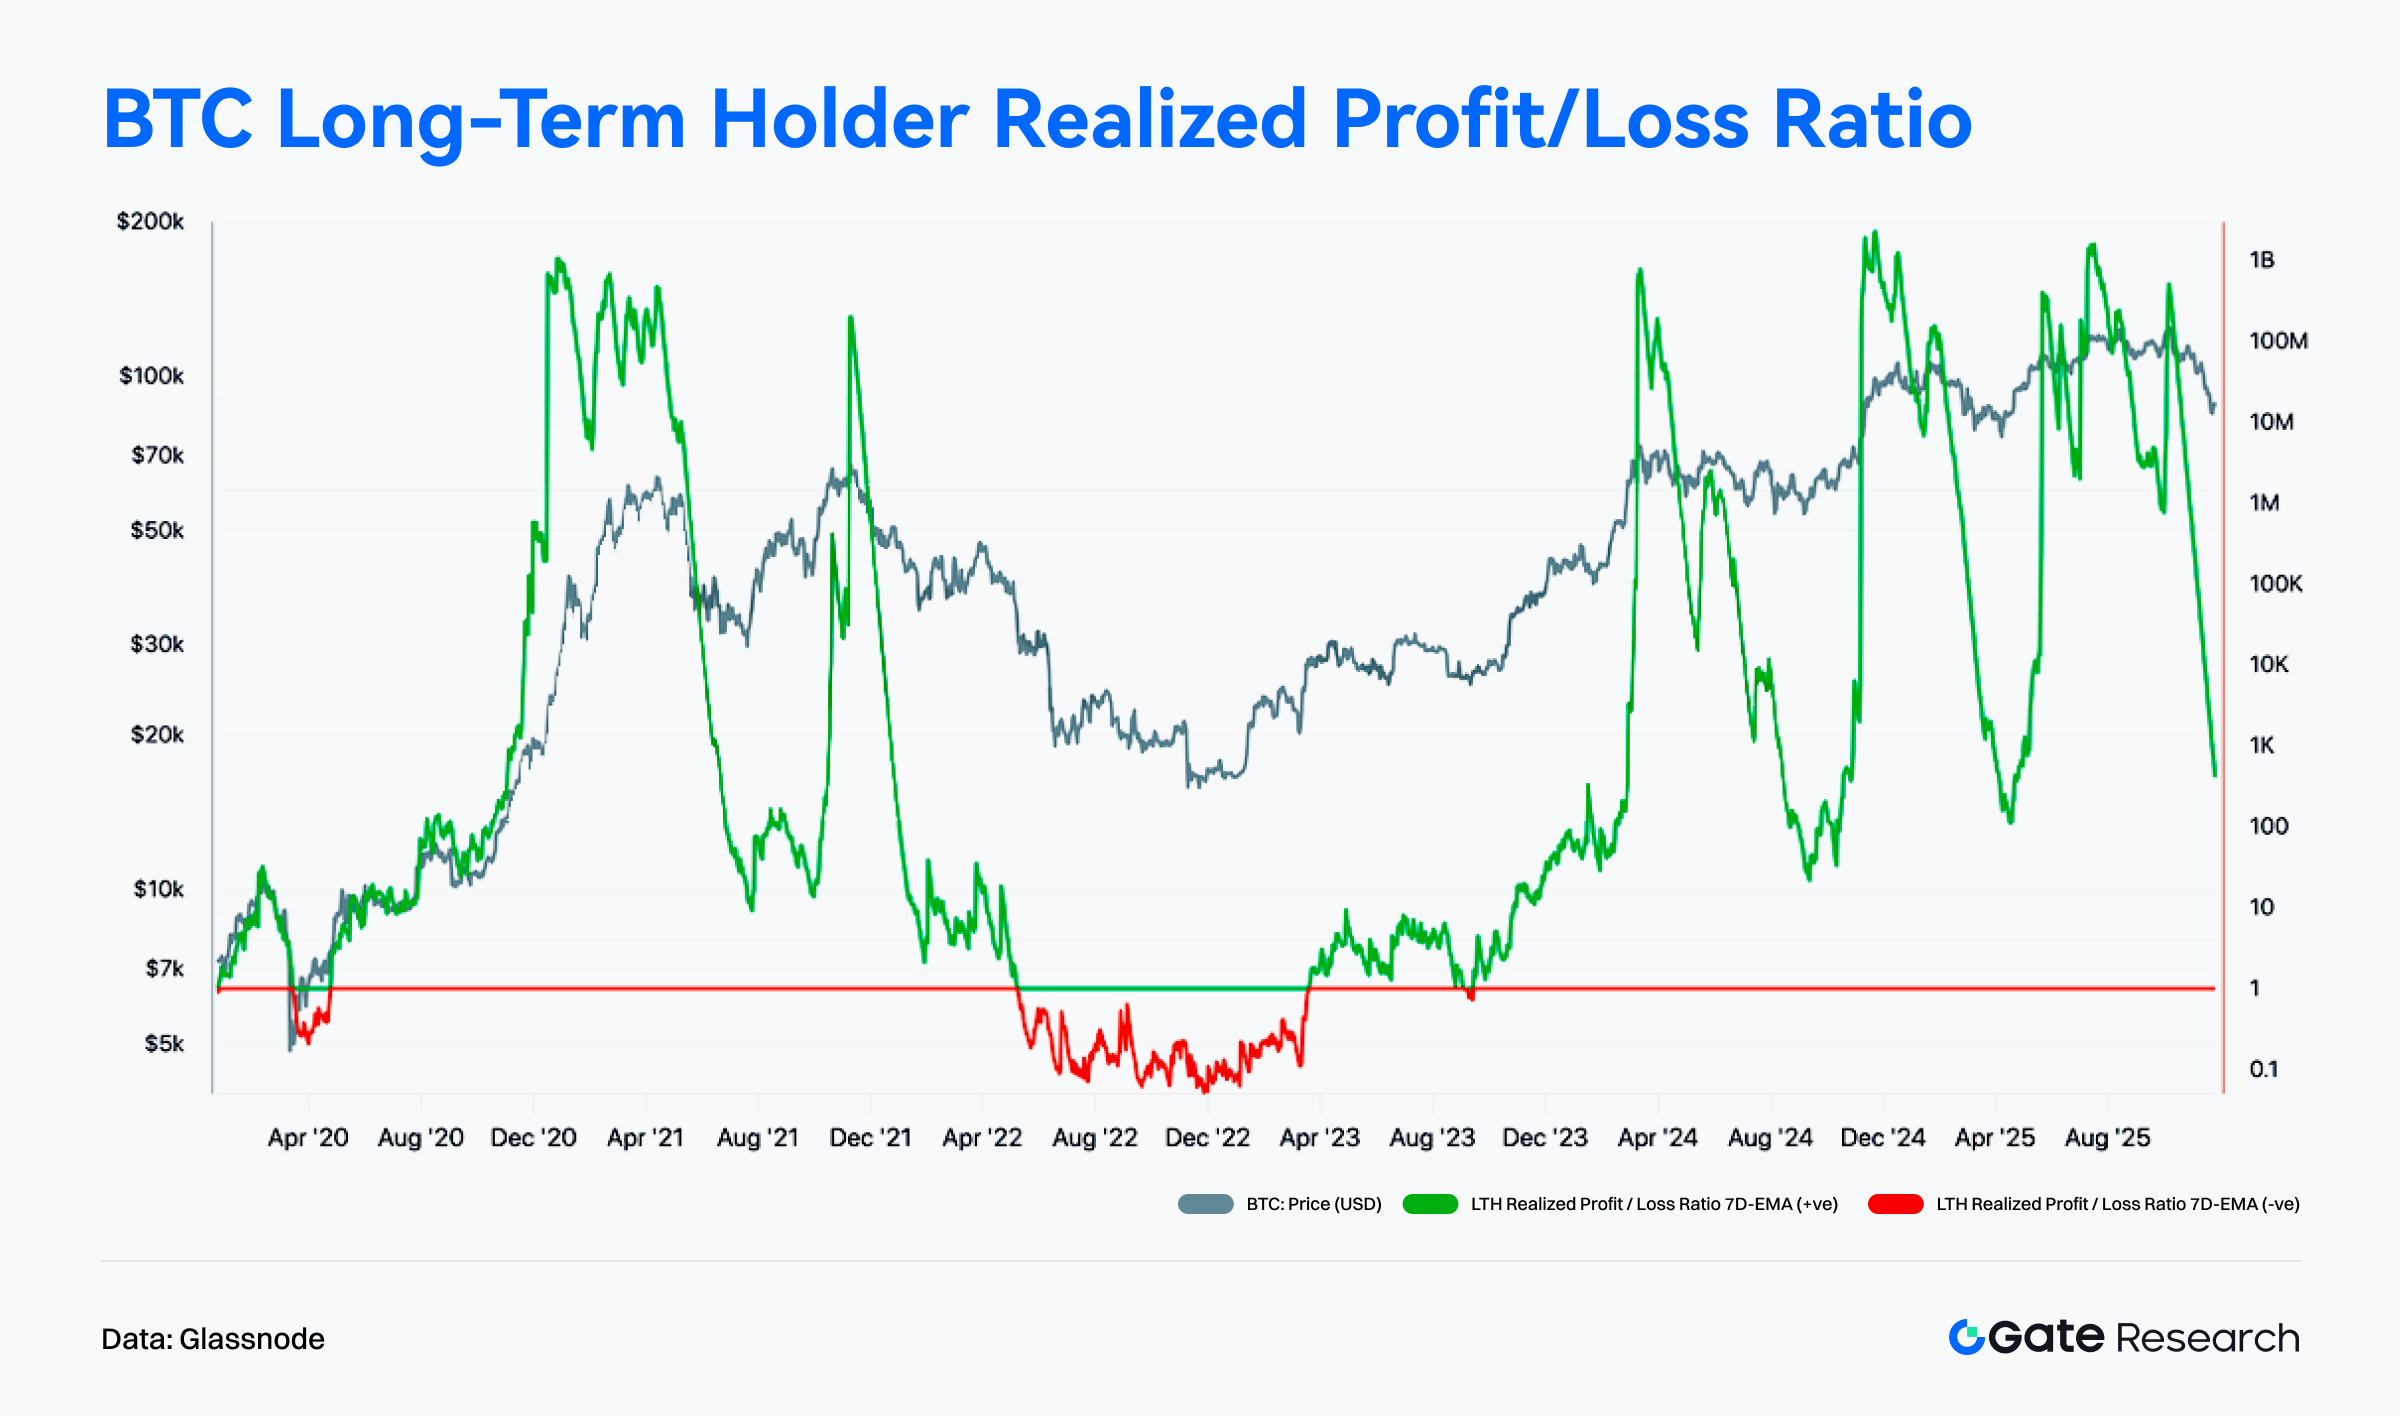
Glassnode data shows a notable downturn in the Long-Term Holder Realized Profit/Loss Ratio (LTH RPLR) over the November period, with the metric falling sharply from elevated levels. This indicates narrowing profitability among long-term holders, with some investors choosing to realize gains as prices softened. Historically, sharp declines in this indicator often appear near cycle tops or during sentiment cooling phases, reflecting early participants’ profits being eroded by market volatility. With BTC still trading in a high-range consolidation, diminishing LTH profitability suggests weakening momentum behind the strong trend and signals a transition into a “trend rotation + profit compression” stage.【8】
Despite the notable decline, the indicator has not fallen into the loss zone associated with bear-market phases (the red region), indicating that long-term holders are not engaging in panic-driven or large-scale loss selling. The metric remains above key thresholds, suggesting the long-term profit structure is still healthy, albeit with slowing marginal gains. If the ratio stabilizes and begins to rise again, it would indicate completion of a healthy rotation phase, laying a foundation for the next trend leg. However, if it continues declining into the loss zone, deeper cyclical correction risks would emerge. Overall, November’s LTH dynamics point to trend cooling and orderly rotation rather than a full-scale reversal.
Trending Project & Token Activity
On-chain data indicates that capital and users are increasingly concentrating in ecosystems with solid interaction foundations and strong application depth. Meanwhile, projects with strong narratives and technological innovation are becoming the new focal points for investors. This section highlights the most prominent projects and tokens of recent weeks, analyzing the logic behind their growth and potential market impact.
Overview of Trending Project
Monad
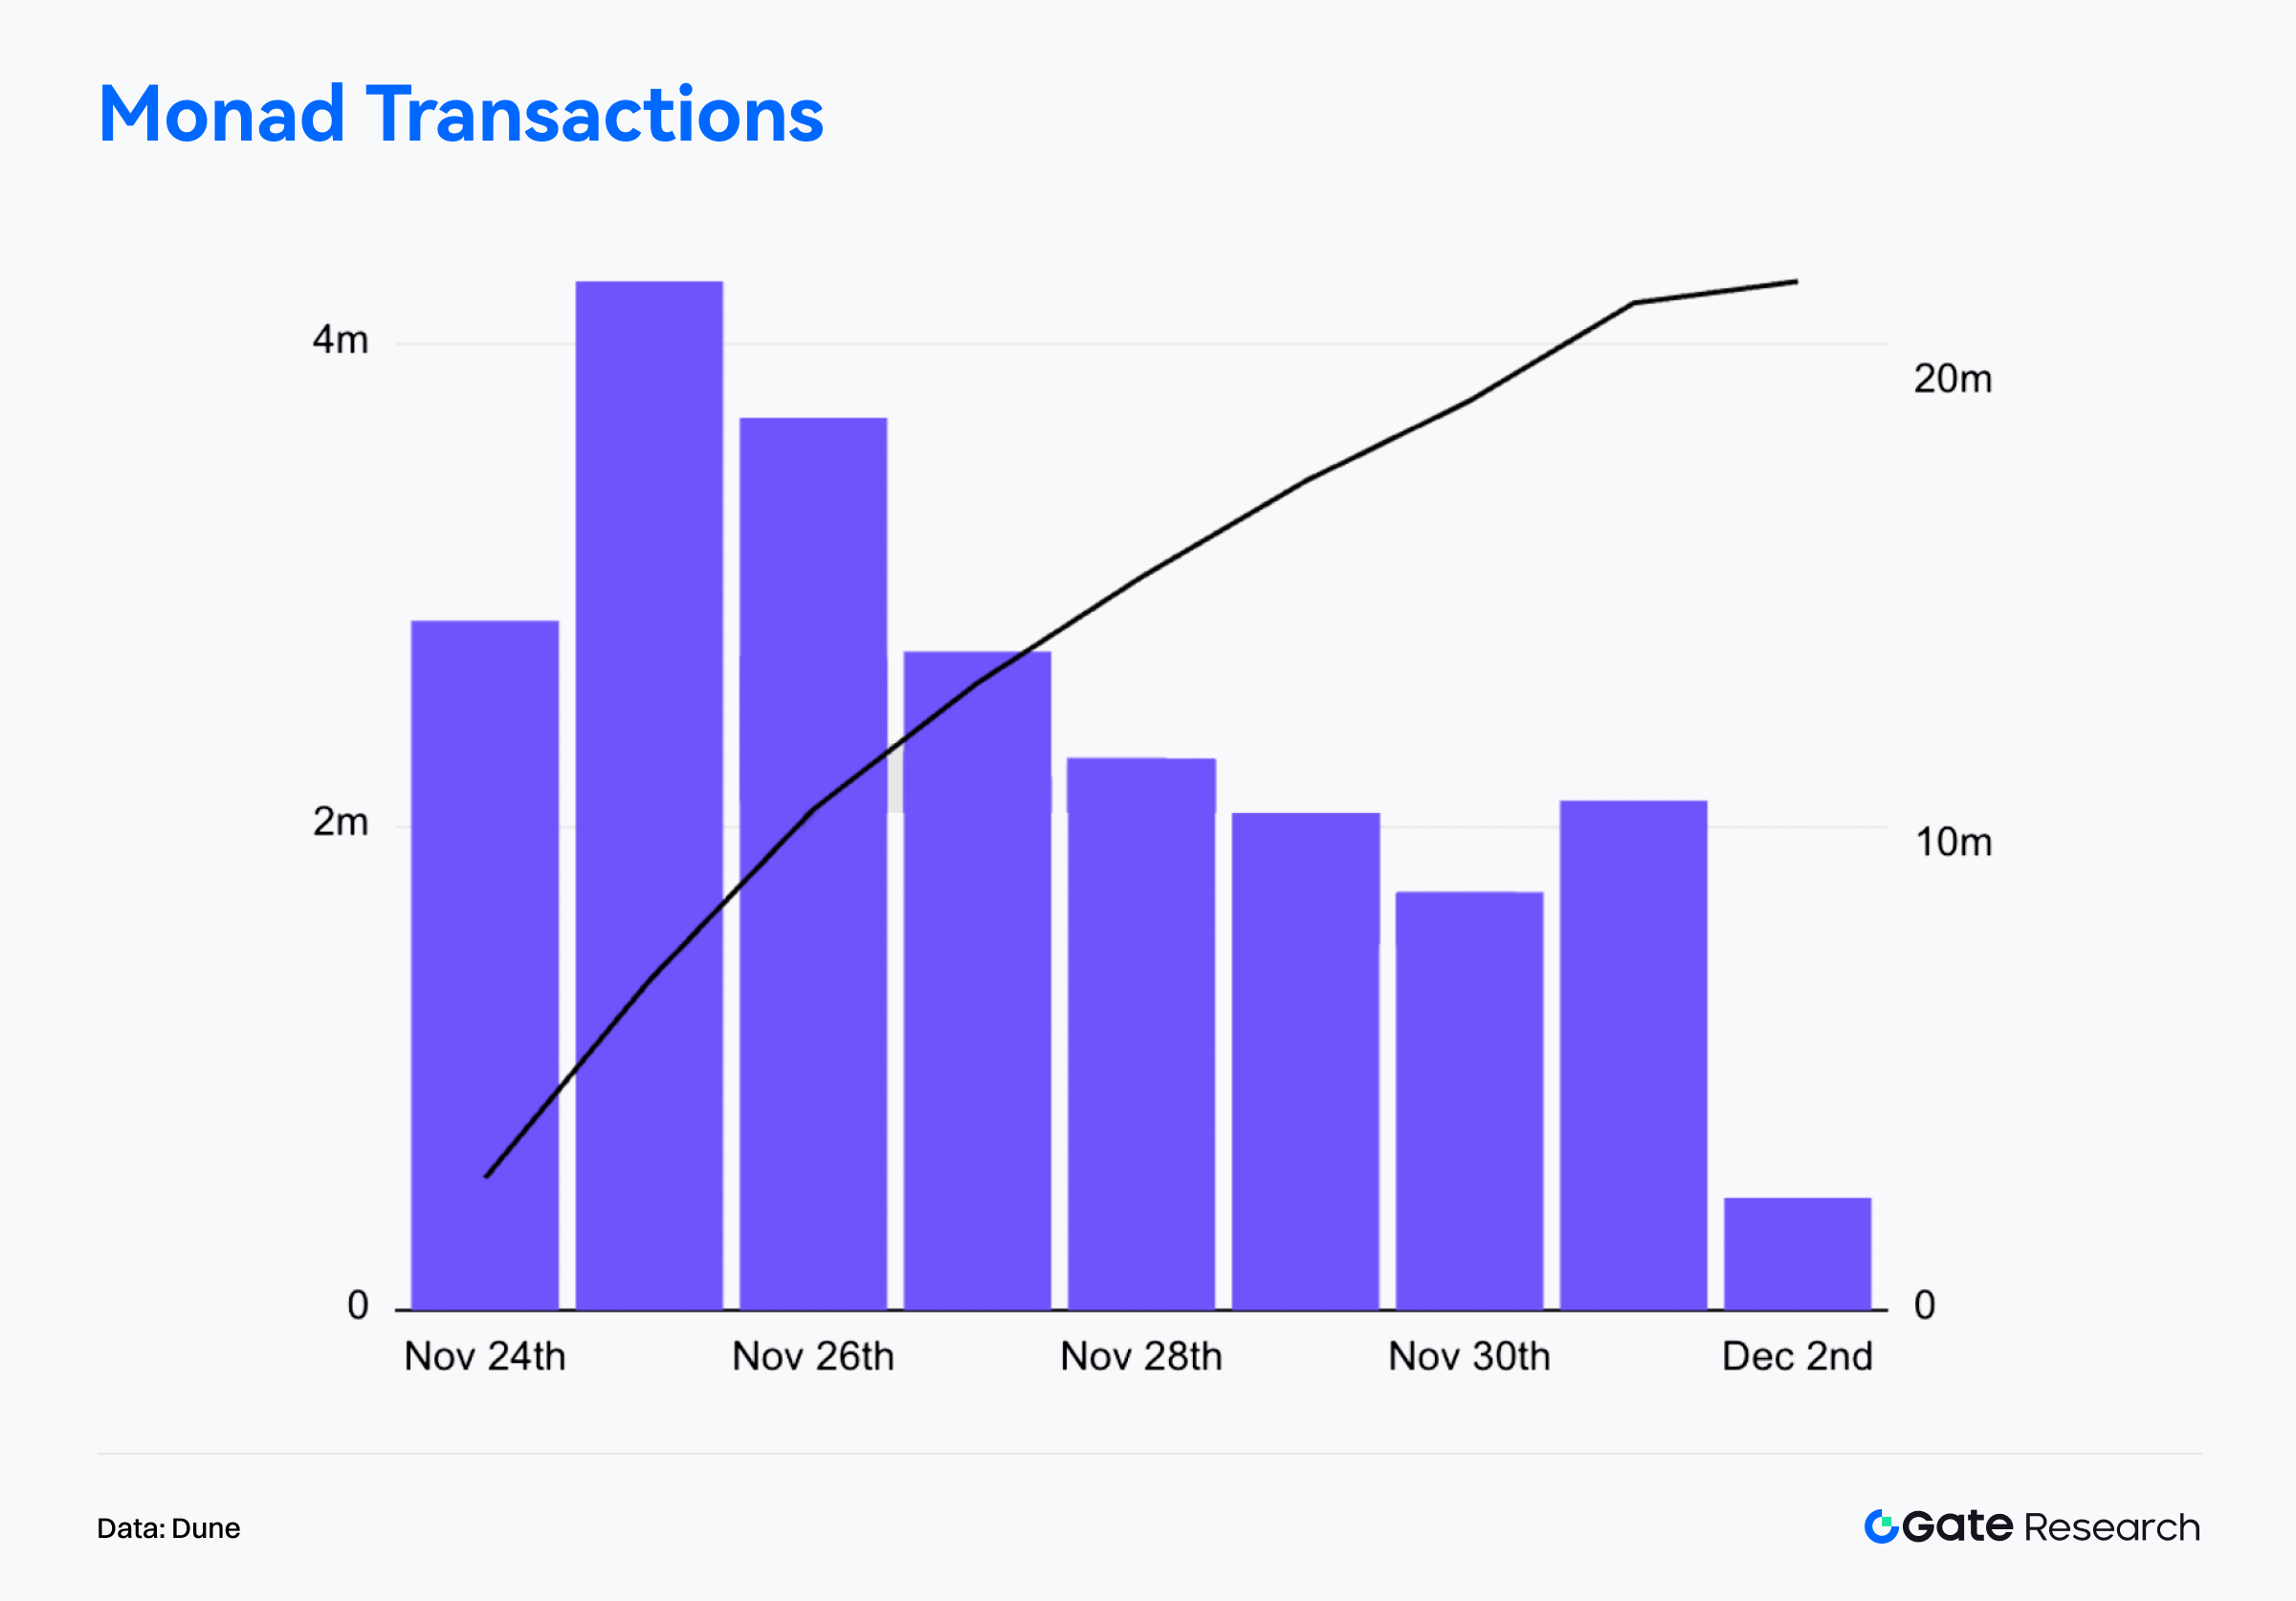
Monad is currently one of the most closely watched high-performance Layer 1 blockchain projects, featuring a “single-threaded, highly efficient EVM” as its core technical path. It aims to significantly enhance execution efficiency and throughput while maintaining full Ethereum compatibility. On November 24, Monad officially launched its mainnet, released its native token MON, and initiated a large-scale airdrop campaign covering 225,000 active on-chain users. Beneficiaries included users of lending protocols such as Aave, Euler, and Morpho; DEX users from Hyperliquid and Uniswap; and participants from social and meme platforms like Pump.fun and Virtuals—resulting in broad cross-sector and cross-ecosystem distribution. On launch day, Monad recorded over 140,000 new active addresses, 2.66 million transactions, and an average 24-hour TPS of 32.75, demonstrating high activity and stable throughput for a newly launched L1.【9】
In terms of price behavior, MON initially followed a classic “sell-the-news” pattern. Influenced by concentrated airdrop profit-taking, ICO allocation releases, and high-frequency speculative flows, the token briefly surged to USD 0.048 at launch before quickly retracing to around USD 0.022—resulting in a short-lived break below initial pricing. Following integrations with OpenSea, the Pyth oracle network, and several wallet tools—and with over 300 ecosystem applications becoming operational—on-chain measured TPS exceeded 5,000, and first-day on-chain trading volume surged to USD 400 million within half a day, marking one of the most volatile new-chain launches in recent cycles.
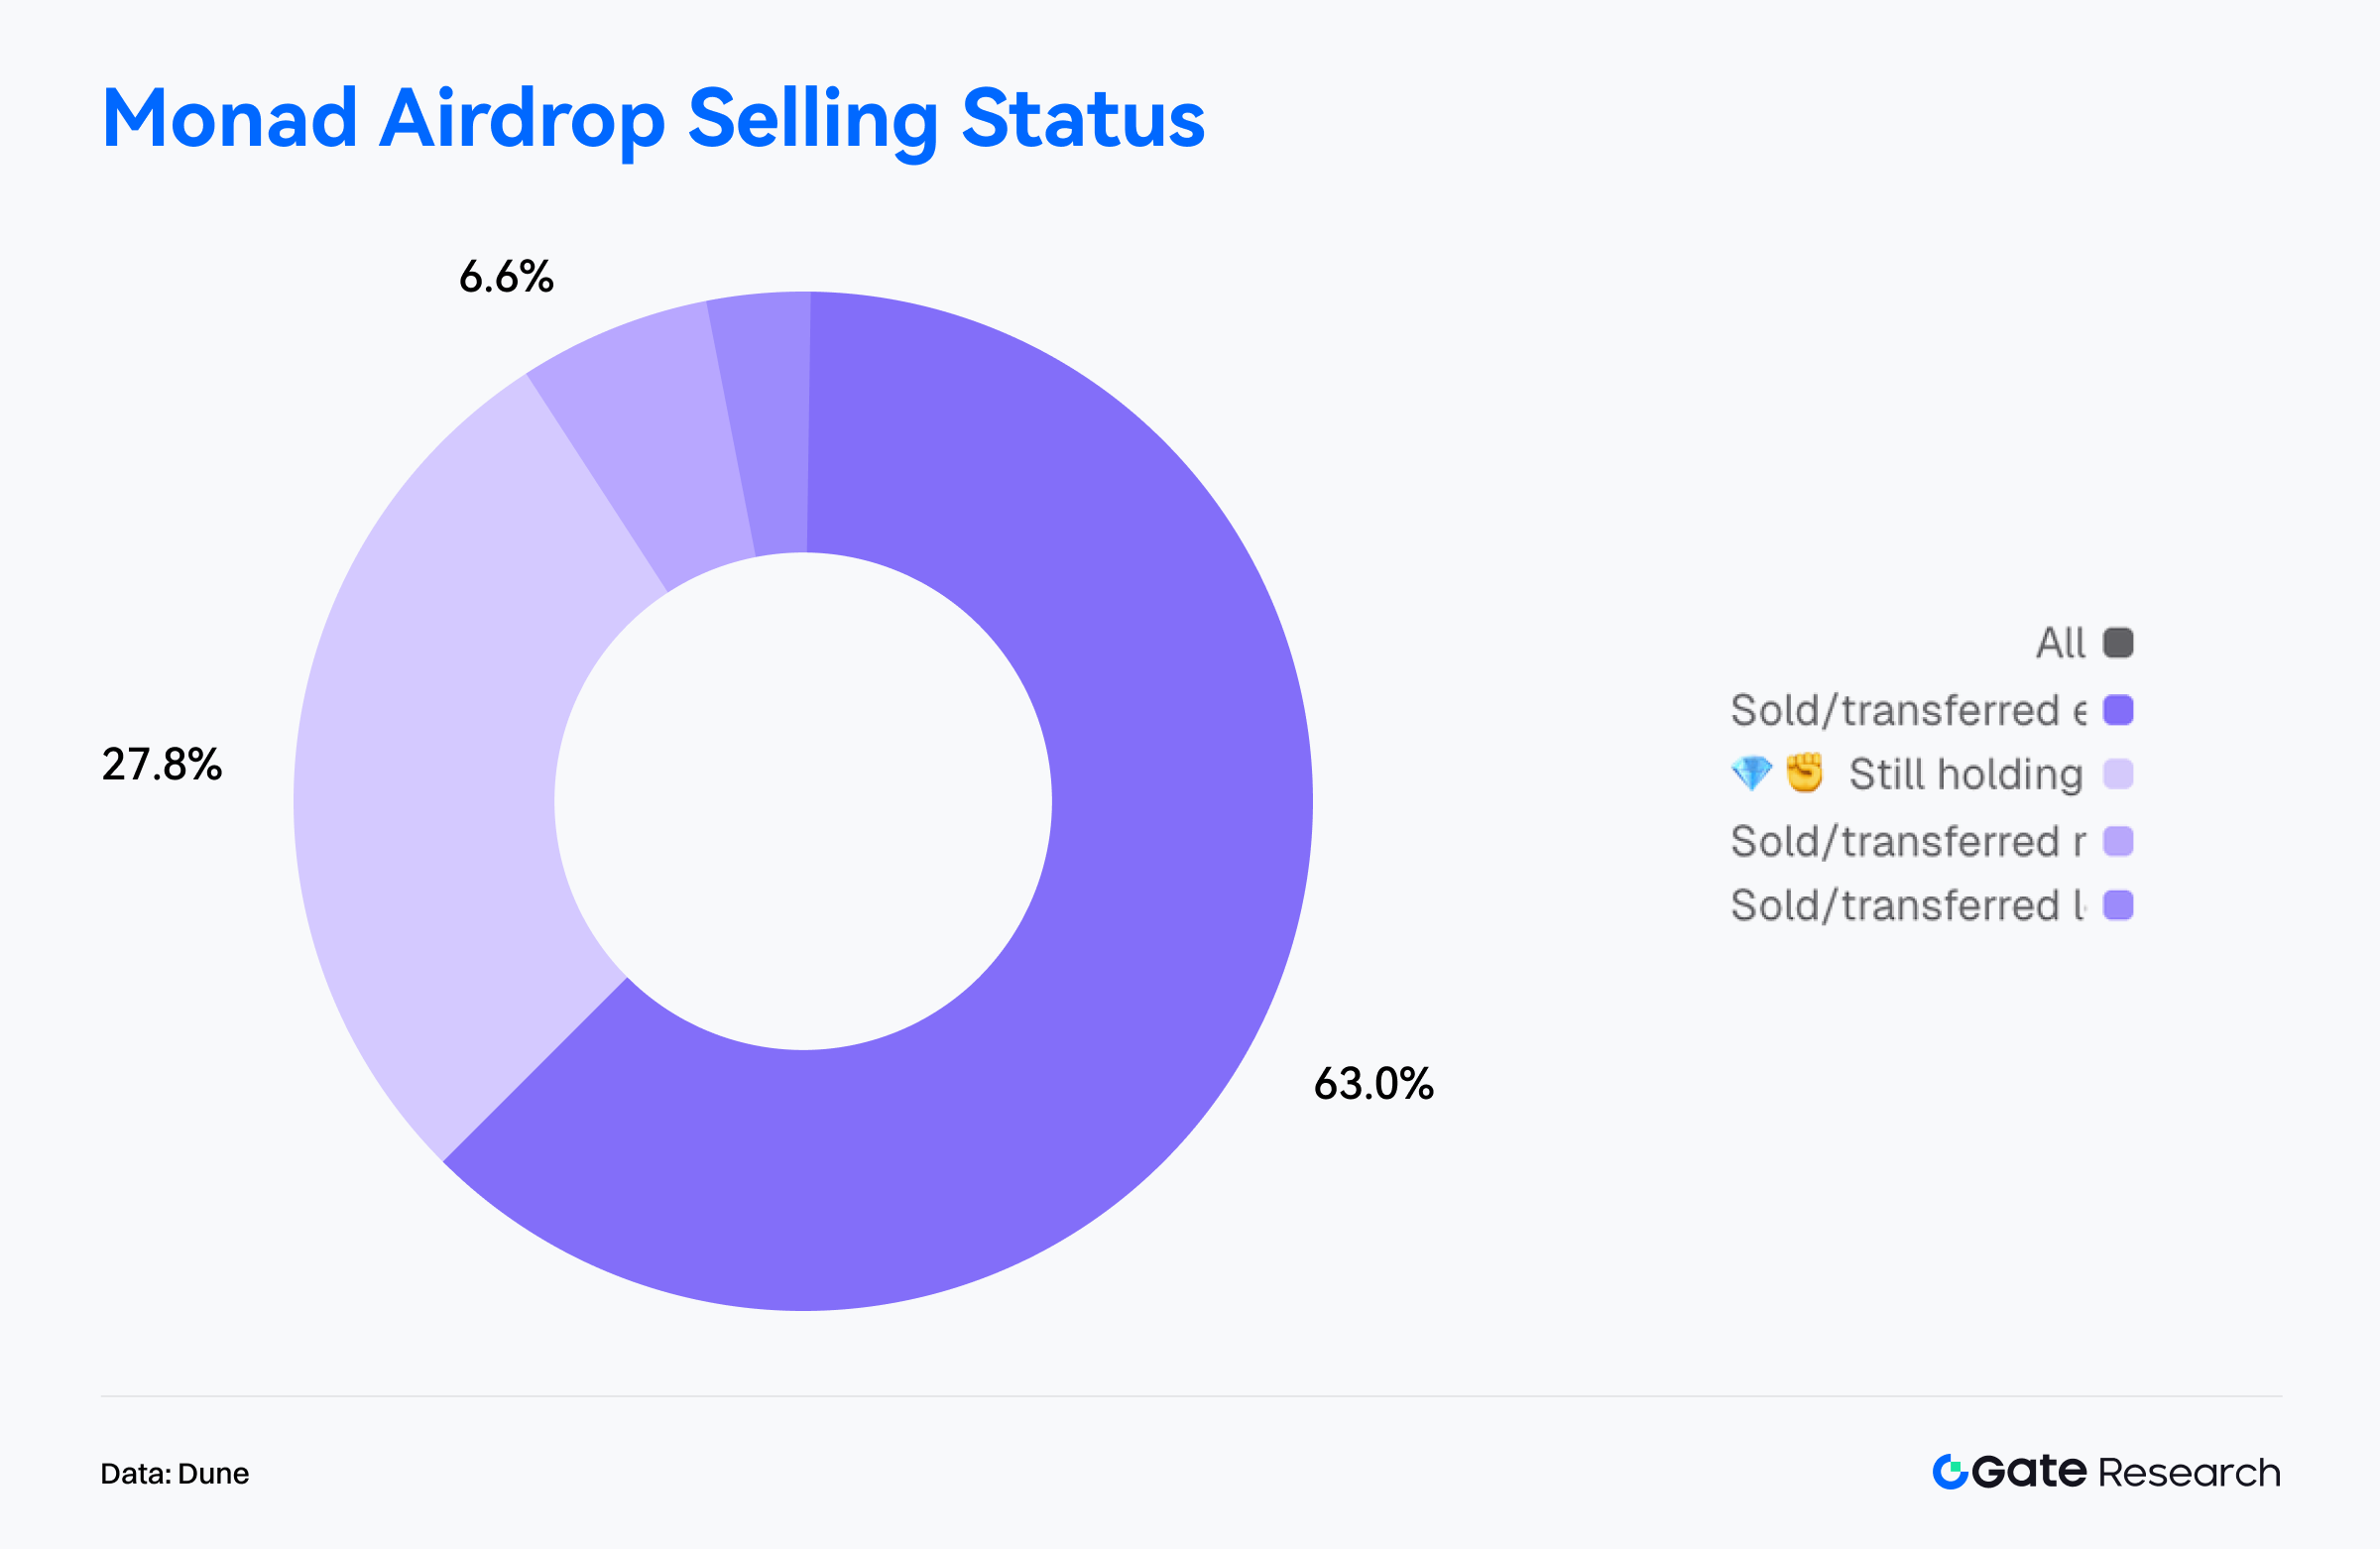
On-chain wallet behavior indicates that airdrop-related selling pressure dominated the early phase. Among the 76,021 addresses that claimed the airdrop, 63% fully sold or transferred their tokens, becoming the main source of sell-side pressure; 27.8% held their entire allocation, reflecting relatively strong long-term conviction; 6.6% sold more than half; and only a small minority retained partial positions. Overall, genuine long-term holders represented less than one-third of all recipients—this concentrated selling was a major catalyst behind MON’s sharp early volatility.【10】
On the incentive side, multiple projects launched MON staking and yield programs to boost liquidity and user engagement. FastLane Labs introduced shMON staking with more than 122 million MON committed; Magma launched gMON liquid staking, offering roughly 15% APY. Concurrently, gaming and application ecosystems began rolling out incentives, including Lumiterra’s 1 million MON season reward pool and Kuru DEX’s program to return 25% of platform fees to participants—collectively driving growing user activity.
Overall, Monad’s market performance aligns with the typical early trajectory of a new L1: technical novelty and high expectations drive initial enthusiasm; airdrops and early liquidity release create short-term price pressure; sustained on-chain activity, incentive programs, and staking demand support medium-term development. Future trends in TVL, developer migration, and ecosystem expansion will determine MON’s medium-term price performance and Monad’s long-term competitiveness—signaling the beginning of a new phase in high-performance L1 competition.
Overview of Trending Token
$TEL
Telcoin, founded in 2017, is a multinational fintech project focused on integrating blockchain, telecommunications, and digital banking to deliver low-cost, instant, and inclusive cross-border remittance and digital asset services for mobile users worldwide. The project operates under the Swiss nonprofit Telcoin Association, runs the EVM-compatible Telcoin Network, and is secured by global mobile operators via a PoS mechanism. Its ecosystem includes the multisig-enabled Telcoin Wallet and the upcoming regulated digital bank Telcoin Bank, designed to create a global infrastructure for “mobile-native access to on-chain finance.”
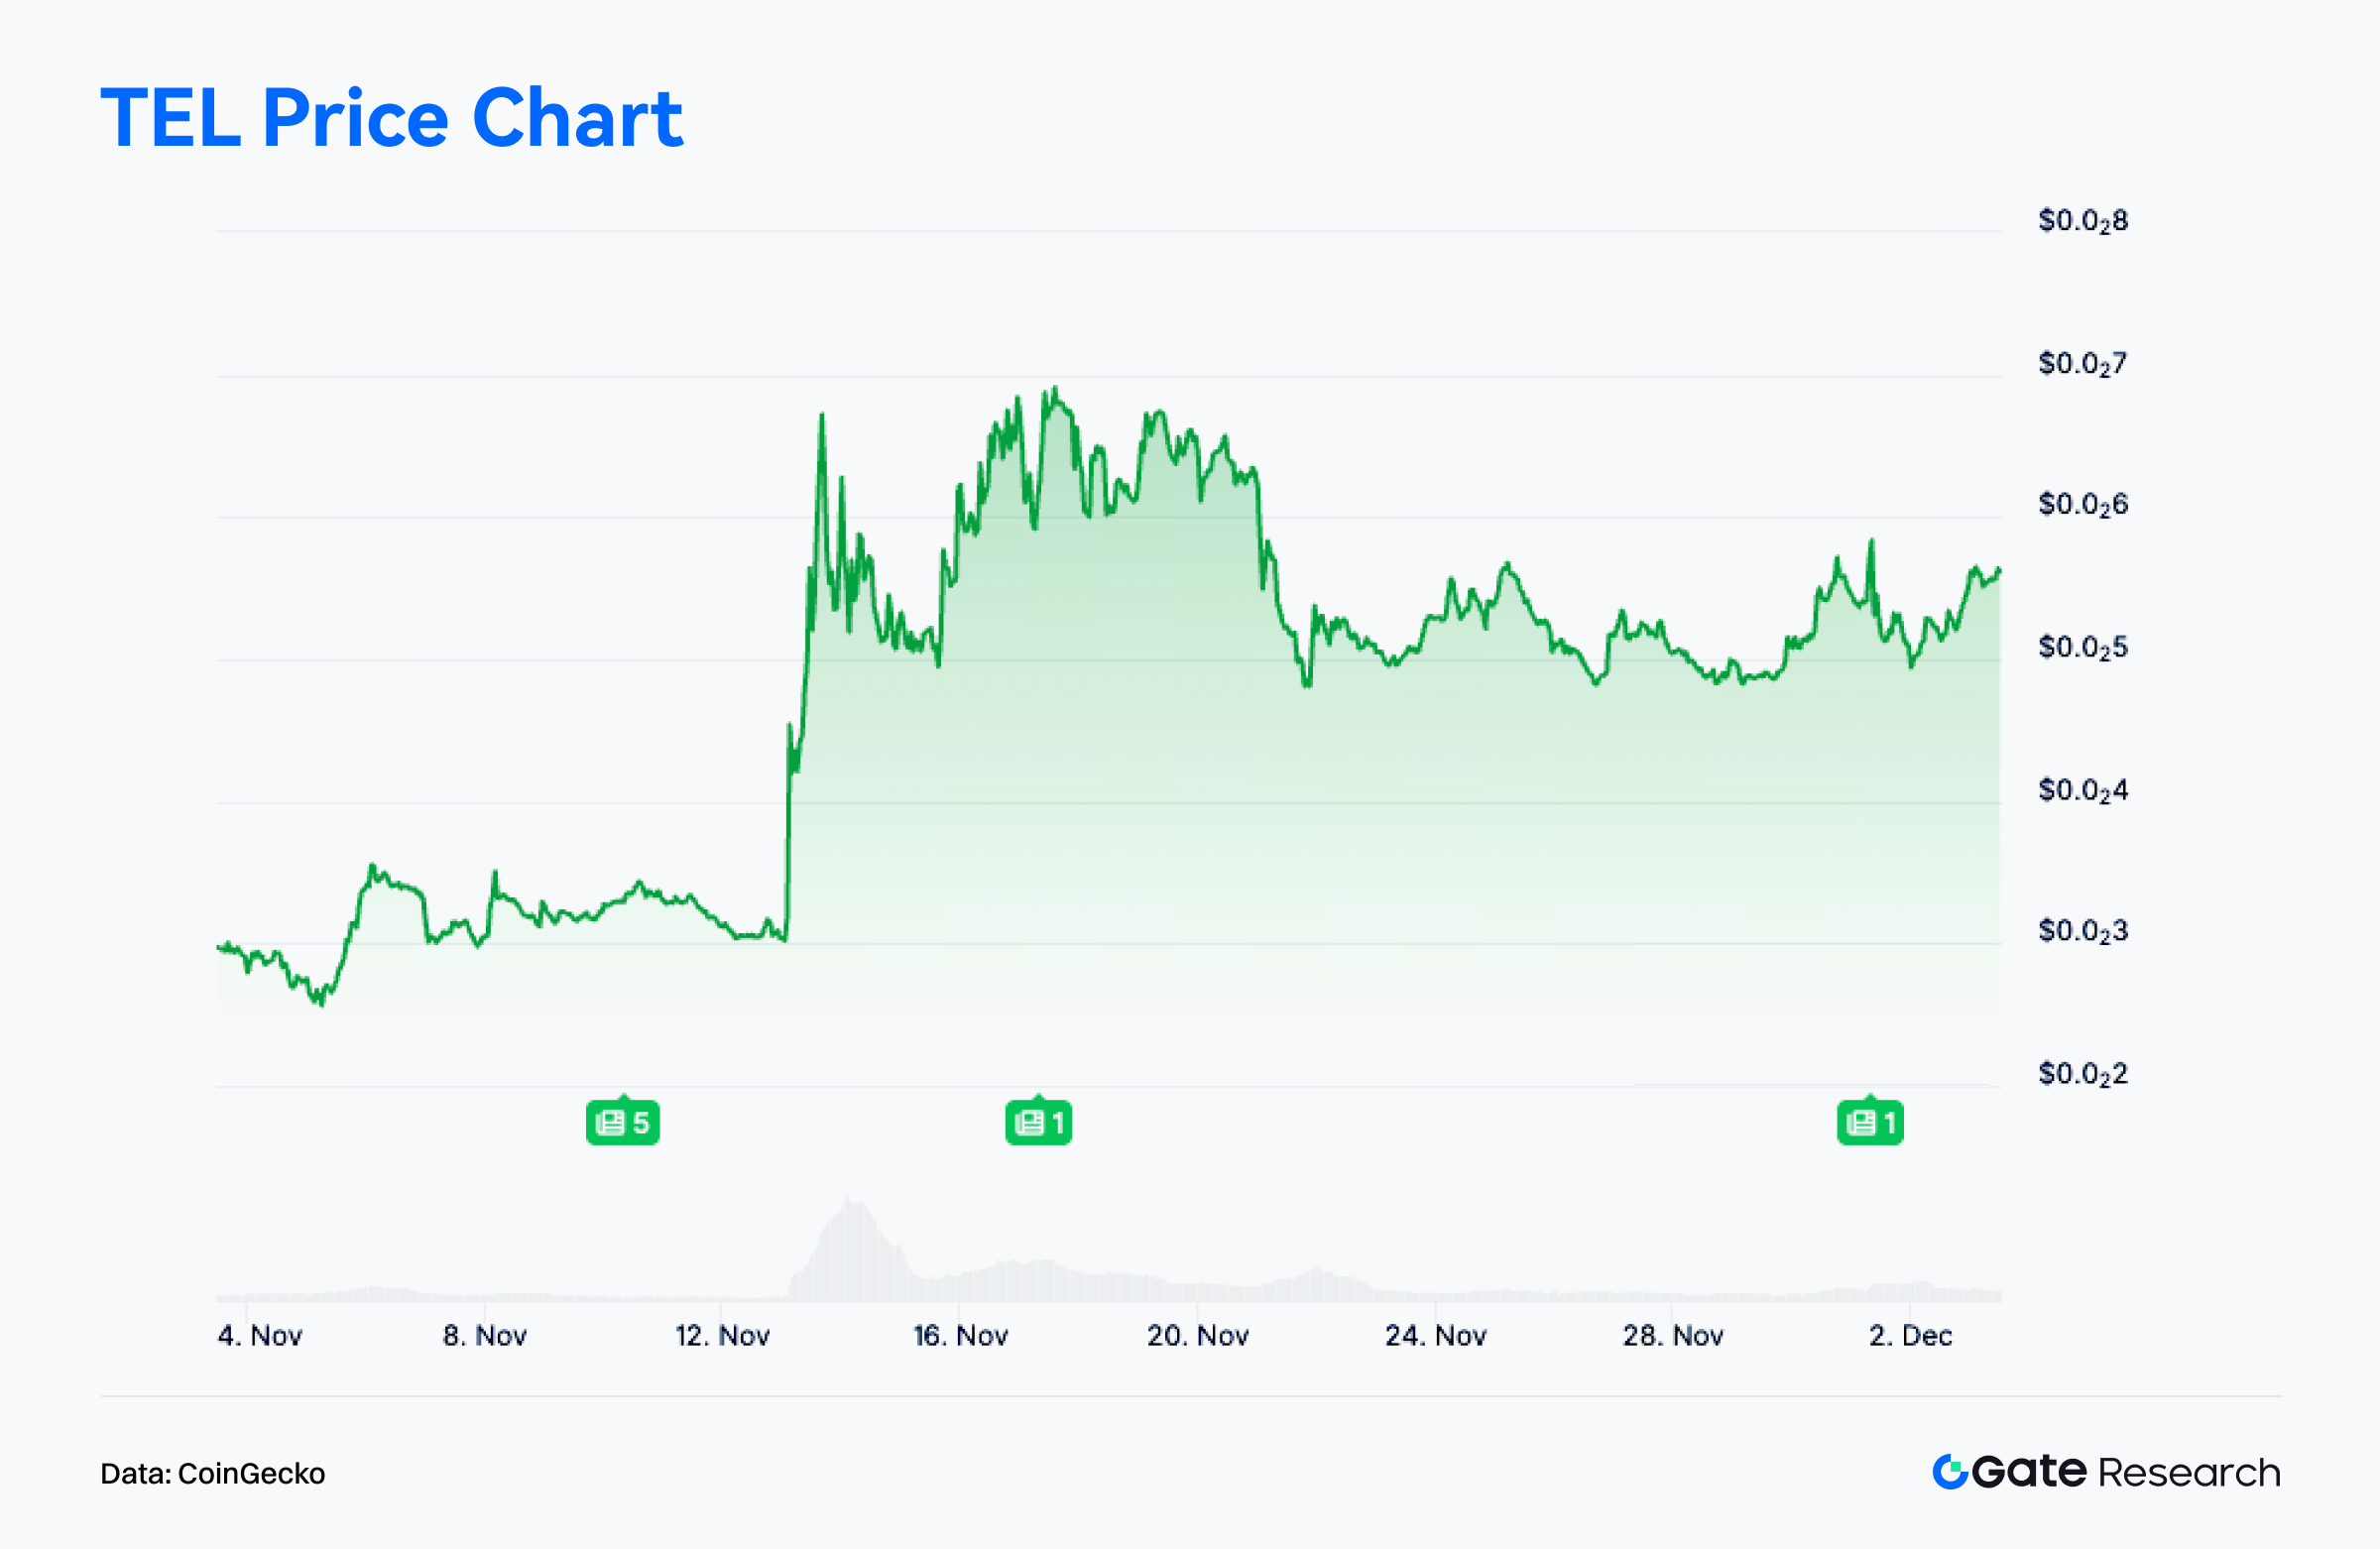
According to CoinGecko, $TEL has gained 88.9% over the past 30 days. This strong performance is closely linked to rising narratives around regulatory-compliant finance, on-chain dollars, and stablecoin oversight, prompting capital rotation away from speculative sectors toward projects with strong fundamentals.【11】
On the development front, Telcoin announced that its digital banking offering and compliant stablecoin eUSD have entered formal deployment. eUSD will be issued and minted on-chain directly by a regulated banking entity—placing it among the first bank-issued on-chain stablecoins. This milestone gives Telcoin a fully integrated financial stack: digital banking capabilities + stablecoin issuance + open DeFi access, materially transforming its business model and long-term strategic positioning and driving a significant market re-rating.
On the community and media side, following these announcements, discussions across X, Telegram, and Reddit surged. Crypto media now frequently cite Telcoin as a “case study in bank–blockchain integration,” placing it within broader narratives such as “next-generation stablecoin competition,” “traditional finance migrating on-chain,” and “mobile-native crypto banking.” Community sentiment has turned uniformly positive, forming a virtuous cycle of narrative reinforcement → increased attention → rising liquidity, which further strengthened short-term inflows and price trends.
Overall, $TEL’s recent rally reflects a classic structure of “fundamental breakthrough + regulatory narrative strengthening + sentiment reinforcement.” The advancement of its digital bank and eUSD stablecoin elevates Telcoin from a cross-border payments project to a comprehensive financial infrastructure combining bank-grade stablecoin issuance with on-chain financial access. If deployment proceeds smoothly and the regulatory finance narrative retains momentum, $TEL may continue its medium-term uptrend after this strong leg higher.
Conclusion
In November 2025, Solana maintained its leadership across the entire ecosystem in both activity and transaction volume, demonstrating resilience and sustained user engagement even through market volatility. Ethereum continued to serve as the core value-settlement layer, leading by a wide margin in fee revenue and maintaining high-value economic activity. Base and Polygon PoS expanded steadily in the mid-tier category, showing consistent growth momentum in social and consumer-driven applications. By contrast, Arbitrum’s transaction volume and active addresses remained range-bound at low levels, yet capital flows indicate strengthening positioning in asset tokenization, infrastructure maturity, and institutional integration—making it a key beneficiary of current market preferences. Meanwhile, emerging chains such as Starknet accelerated under the BTCFi narrative, exhibiting rapid user and capital growth.
Overall, on-chain ecosystems are shifting from purely liquidity-driven cycles toward usage-driven, application-driven, and narrative-driven structural growth. High-performance chains continue to dominate interaction flows, value-oriented chains reinforce their foundational role, and mid-tier/emerging ecosystems with strong application momentum and narrative expansion have become focal points for capital rotation—pushing ecosystem growth toward increasing plurality and stratification.
For Bitcoin, the recent drop below the short-term holder cost basis and active investor mean indicates a more pronounced redistribution phase at higher levels, shifting near-term structure from strong to pressured. The Realized Price and True Market Mean below current price still provide medium- to long-term support, meaning the broader bull framework remains intact. However, the break below cost lines places part of the market in unrealized-loss territory, accelerating churn as realized losses rise and the market enters a “repricing and rebalancing” transitional stage. The next directional move will depend on whether BTC can digest overhead supply effectively and rebuild incremental demand once sentiment stabilizes.
At the project level, Monad demonstrated strong early activity and rapid ecosystem expansion despite airdrop-induced sell pressure, while Telcoin achieved a clear rerating driven by advancements in its digital bank and regulated stablecoin. These trends illustrate a broader market transition from speculative rotation toward sustained growth driven by real usage and robust ecosystem fundamentals.
References:
- Artemis, https://app.artemisanalytics.com/chains
- Artemis, https://app.artemisanalytics.com/chains
- Artemis, https://app.artemisanalytics.com/chains
- Artemis, https://app.artemisanalytics.com/flows
- DefiLlama, https://defillama.com/chain/arbitrum
- Glassnode, https://studio.glassnode.com/charts/da73676e-78a6-4880-5ca2-a227ee301230?s=1579395107&zoom=
- Glassnode, https://studio.glassnode.com/charts/indicators.RealizedLossAccountBased?a=BTC&chartStyle=column&mAvg=30&s=1602806400&u=1764115200&zoom=
- Glassnode, https://studio.glassnode.com/charts/btc-lth-realized-plratio?s=1577318400&u=1764115200&zoom=
- Dune, https://dune.com/hashed_official/monad-overview
- Dune, https://dune.com/counterparty_research/monad
- CoinGecko, https://www.coingecko.com/coins/telcoin
Gate Research is a comprehensive blockchain and cryptocurrency research platform that provides deep content for readers, including technical analysis, market insights, industry research, trend forecasting, and macroeconomic policy analysis.
Disclaimer
Investing in cryptocurrency markets involves high risk. Users are advised to conduct their own research and fully understand the nature of the assets and products before making any investment decisions. Gate is not responsible for any losses or damages arising from such decisions.
Share
Content


Related Articles

Reflections on Ethereum Governance Following the 3074 Saga

Gate Research: 2024 Cryptocurrency Market Review and 2025 Trend Forecast

Gate Research: BTC Breaks $100K Milestone, November Crypto Trading Volume Exceeds $10 Trillion For First Time

NFTs and Memecoins in Last vs Current Bull Markets

Altseason 2025: Narrative Rotation and Capital Restructuring in an Atypical Bull Market