
Date: Sun, Dec 21 2025 | 08:56 AM GMT
The broader cryptocurrency market has remained under pressure over the past several weeks, following the sharp sell-off that began on October 10. That corrective phase dragged Ethereum (ETH) down by nearly 23% over the last 60 days and weighed heavily on overall market sentiment. While many altcoins have struggled to stabilize, Quant (QNT) has shown relative resilience, posting only a modest decline and holding above a historically important support zone.
From a technical perspective, the daily chart suggests that QNT may be approaching a critical decision point, with price action forming a recognizable structure that could influence its next directional move.
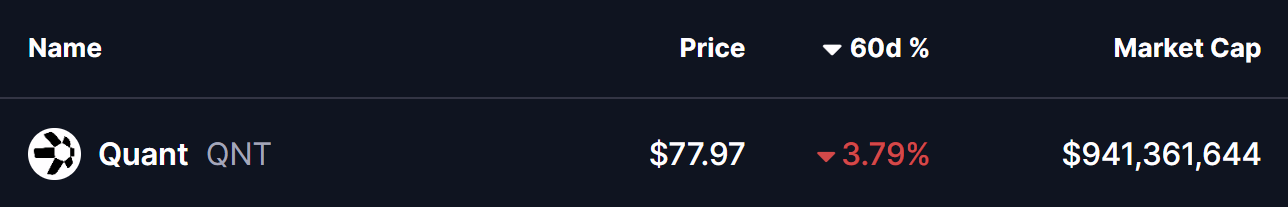
Source: Coinmarketcap
Head and Shoulders Pattern Takes Shape
On the daily timeframe, QNT appears to be carving out a head and shoulders formation, a well-known pattern that often signals a potential trend shift once the neckline is tested. Earlier in the structure, QNT formed the left shoulder before rallying sharply to its head near the $100 region. From there, price reversed lower and slid back toward the neckline, located around the $70 support zone.
This $70 area has proven to be a strong demand zone in the past, repeatedly attracting buyers and preventing deeper declines. The recent move into this region was met with a noticeable reaction, as reflected by the long lower wick on the chart. That rejection from support pushed price back toward the $78 level, suggesting that buyers are actively defending the neckline and potentially forming the right shoulder of the pattern.
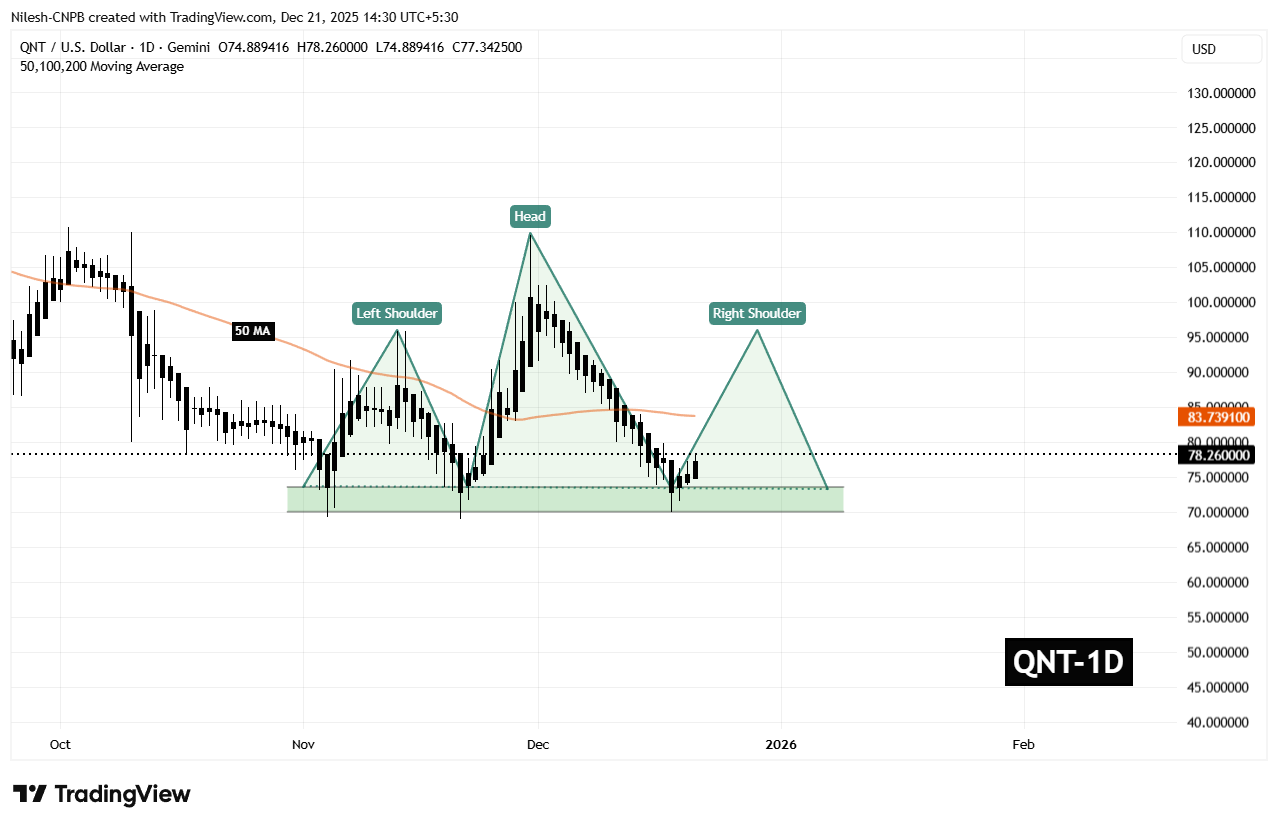
Quant (QNT) Daily Chart/Coinsprobe (Source: Tradingview)
The behavior around this zone is critical. A successful defense of the neckline often opens the door for a relief rally, especially if broader market conditions stabilize.
What’s Next for QNT?
For bullish momentum to build, QNT needs to reclaim the 50-day moving average, currently sitting near $83.73. This level now acts as a key short-term resistance, and a daily close above it would signal a shift in momentum back in favor of buyers.
If that recovery unfolds, the chart points toward a potential move into the $95.90 region. Such a move would represent a rebound of roughly 22% from current levels and align with the typical reaction seen during the right-shoulder phase of this pattern. A rally of this nature would not only ease recent selling pressure but also place QNT back into a more neutral technical posture.
That said, the setup remains delicate. If the $70 neckline support fails to hold on a sustained basis, the head and shoulders structure would remain bearish, opening the door to further downside and extending the corrective phase. For now, all eyes remain on how price behaves around this key support and whether buyers can regain control above the moving average.
Disclaimer: The views and analysis presented in this article are for informational purposes only and reflect the author’s perspective, not financial advice. Technical patterns and indicators discussed are subject to market volatility and may or may not yield the anticipated results. Investors are advised to exercise caution, conduct independent research, and make decisions aligned with their individual risk tolerance.
Disclaimer: The information on this page may come from third parties and does not represent the views or opinions of Gate. The content displayed on this page is for reference only and does not constitute any financial, investment, or legal advice. Gate does not guarantee the accuracy or completeness of the information and shall not be liable for any losses arising from the use of this information. Virtual asset investments carry high risks and are subject to significant price volatility. You may lose all of your invested principal. Please fully understand the relevant risks and make prudent decisions based on your own financial situation and risk tolerance. For details, please refer to
Disclaimer.
Related Articles
The Hormuz Strait crisis remains unresolved, and Bitcoin has fallen below 68K.
Affected by the US-Iran conflict, global markets have been severely impacted, with the S&P 500 Index declining for four consecutive weeks. Gold has experienced a modest rebound around $4,500, while oil prices remain stable at elevated levels. Trump has issued an ultimatum to Iran, with potential escalation of conflict between the two sides. Bitcoin and Ethereum have also declined in tandem, and market sentiment has turned conservative.
ChainNewsAbmedia8m ago
River (RIVER) Price Keeps Pumping as TD Indicator Signals Another Rally
Analyst Ali Martinez highlights the accuracy of the TD Sequential indicator in predicting River (RIVER) price movements. The indicator has consistently identified significant buy and sell signals throughout RIVER's volatility, suggesting potential future trends based on current signals.
CaptainAltcoin1h ago
ETH 15-minute decline of 0.88%: Capital outflow dominates market, intensifying short-term selling pressure
On March 22, 2026, from 21:00 to 21:15 (UTC), Ethereum (ETH) recorded a -0.88% return rate within 15 minutes, with the price fluctuating in the range of 2029.54 to 2060.75 USDT, reaching an amplitude of 1.52%. Market attention has increased, short-term volatility has significantly intensified, reflecting rapid conversion of funding pressure into price pressure.
The main driver of this anomaly is accelerated capital outflows from trading platforms: approximately 420,690 USD equivalent of ETH flowed in within 10 minutes, but the number of withdrawals reached 2,319 transactions in the past 1 hour, far exceeding deposits during the same period by 5
GateNews2h ago
BTC Drops 0.58% in 15 Minutes: Tight Liquidity and Institutional Hedging Create Downward Pressure
2026-03-22 21:00 to 21:15 (UTC), BTC recorded a -0.58% return within just 15 minutes, with prices fluctuating in the range of 67562.1 to 68223.5 USDT, with an amplitude of 0.97%. During this period, market sentiment was highly tense, overall attention increased, and short-term volatility accelerated noticeably.
The main driving force behind this anomaly was the resonance formed by spot market liquidity shortage and medium-sized funds accelerating their exit. On-chain data shows a significant net outflow of -371.99 BTC in the $100k-$1M transaction range, driving selling
GateNews2h ago
Risk-Off Drips throughout Markets
Geopolitical tensions and rising uncertainty have led to a risk-off sentiment in global markets, with investors moving away from assets like Bitcoin and Ethereum. High oil prices and inflation concerns influenced portfolio adjustments, while Bitcoin selling pressure increased as short-term holders took profits. The market remains sensitive amid low sentiment.
CryptoBreaking3h ago
