
Date: Mon, Dec 29, 2025 | 08:30 AM GMT
The broader cryptocurrency market has kicked off the final week of 2025 on a constructive note, with both Bitcoin (BTC) and Ethereum (ETH) posting gains of over 2%. This steady strength among major assets has helped stabilize market sentiment, creating room for select altcoins — including Sui (SUI) — to develop promising technical structures.
SUI is trading with a modest intraday gain, but more importantly, its price action is beginning to reflect a clear structural shift. The chart suggests that selling pressure is fading and that a potential bullish continuation phase may be forming beneath the surface.
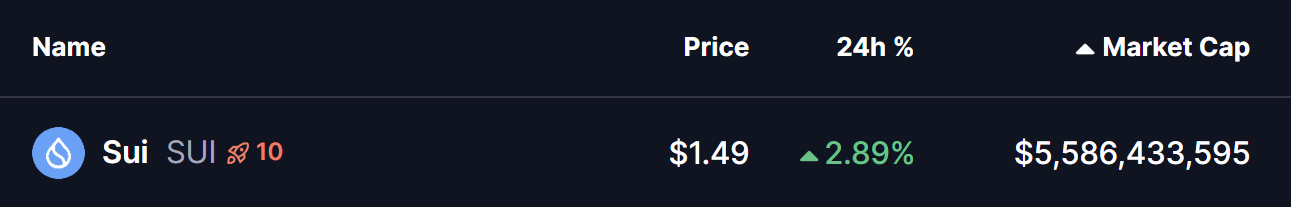
Source: Coinmarketcap
Bearish Bat Pattern in Play?
On the 4-hour timeframe, SUI appears to be carving out a Bearish Bat harmonic pattern. Despite its name, this structure often allows for an upside move toward the completion point before any broader trend decision takes place.
The formation started from Point X near the $1.728 area, followed by a sharp decline into Point A. Price then staged a recovery toward Point B before undergoing a deeper corrective move into Point C around $1.35. This region acted as a strong demand zone, where buyers consistently stepped in to absorb selling pressure.
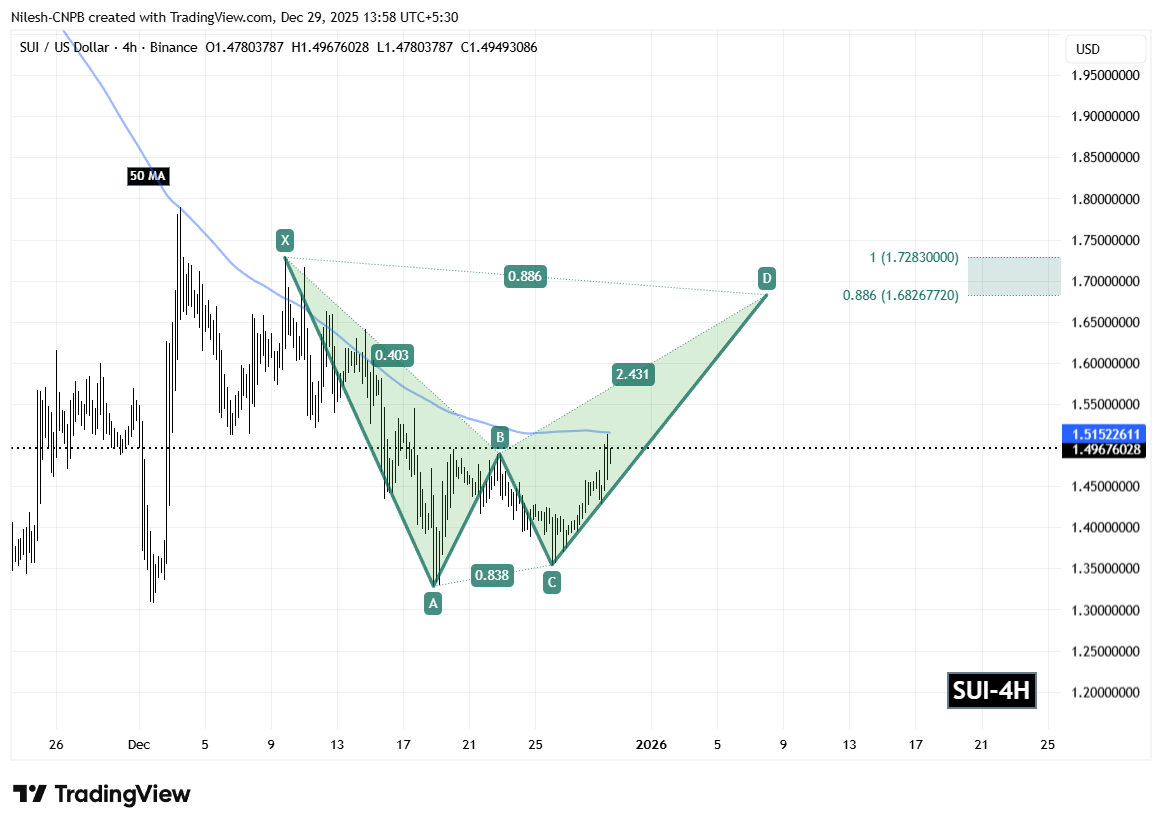
Sui (SUI) 4H Chart/Coinsprobe (Source: Tradingview)
Since printing the Point C low, SUI has shown steady recovery behavior and is currently trading around the $1.49 level. This rebound highlights waning bearish momentum and growing buyer confidence at lower prices.
Adding further technical weight to the setup, the 50-period moving average on the 4-hour chart is positioned near $1.51. A decisive reclaim and sustained hold above this level would reinforce bullish momentum and validate the ongoing recovery structure.
What’s Next for SUI?
If buyers continue to defend the $1.43 support zone and successfully flip the 50-hour moving average into support, the harmonic structure suggests a continuation move toward the Potential Reversal Zone (PRZ).
Based on Fibonacci projections, the PRZ lies between $1.6826 (0.886 extension) and $1.7283 (1.0 extension). This zone represents a potential upside of roughly 15% from current levels and aligns closely with classic harmonic completion targets, where price reactions often intensify.
For now, SUI’s technical outlook remains constructive. As long as support holds and momentum continues to build, the harmonic pattern indicates that the next meaningful move may favor the upside, positioning SUI for a test of higher resistance zones in the sessions ahead.
Disclaimer
The views and analysis presented in this article are for informational purposes only and reflect the author’s perspective, not financial advice. Technical patterns and indicators discussed are subject to market volatility and may or may not yield the anticipated results. Investors are advised to exercise caution, conduct independent research, and make decisions aligned with their individual risk tolerance.
About Author
Nilesh Hembade is the Founder and Lead Author of Coinsprobe, with over 5 years of experience in the cryptocurrency and blockchain industry. Since launching Coinsprobe in 2023, he has been providing daily, research-driven insights through in-depth market analysis, on-chain data, and technical research.

Disclaimer: The information on this page may come from third parties and does not represent the views or opinions of Gate. The content displayed on this page is for reference only and does not constitute any financial, investment, or legal advice. Gate does not guarantee the accuracy or completeness of the information and shall not be liable for any losses arising from the use of this information. Virtual asset investments carry high risks and are subject to significant price volatility. You may lose all of your invested principal. Please fully understand the relevant risks and make prudent decisions based on your own financial situation and risk tolerance. For details, please refer to
Disclaimer.
Related Articles
Bitcoin Slips Below $70,000 as Fed Rate Pause and Oil Surge Pressure Markets
Bitcoin declined to $70,000 due to steady interest rates from the Federal Reserve and rising energy prices, leading to $600 million in liquidations and increased market volatility, particularly affecting altcoins.
CryptoBreaking12m ago
XRP Climbs 3% Past $1.47 as Breakout Extends on Bitcoin-Led Rally
Key Takeaways
XRP broke above $1.426 resistance after months of consolidation, jumping to $1.47 on surging volume
Trading volume spiked over 250% during the move, indicating strong participation in the breakout
Activity on the XRP Ledger continues climbing, with tokenized real-world assets
CryptoBreaking17m ago
BTC down 0.65% in 15 minutes: Large spot selling orders dominate short-term pullback, panic sentiment intensifies volatility amplification
2026-03-20 13:45 to 2026-03-20 14:00 (UTC), BTC declined 0.65% within 15 minutes, with price range fluctuating between 69795.3 to 70399.4 USDT, reaching an amplitude of 0.86%. Market volatility intensified in the short term, trading activity increased, and investor attention rose.
The main driver of this price movement was concentrated large-scale active selling in the spot market. During this period, major trading platforms saw multiple large sell orders exceeding 100 BTC each, with sell orders accounting for 52% of volume, directly driving prices downward.
GateNews1h ago
AI Cryptocurrency Bittensor TAO Leads the List of Trending Tokens
Bittensor (TAO) is currently the top trending cryptocurrency, gaining 14.21% in 24 hours, while ZBCN and PHA follow. TAO is expected to face a brief correction, highlighting the volatile nature of crypto markets.
TheNewsCrypto3h ago
