 SEI is finally getting a bit of relief after a rough stretch. Over the past day, the SEI price has pushed higher and reclaimed levels it recently lost, which naturally stands out in a market that’s still feeling cautious overall.
That said, this move doesn’t look like a full trend change just yet. The SEI chart indicates buyers stepped in at a familiar support zone, triggering a bounce, but whether that bounce can turn into something bigger is still an open question.
SEI is finally getting a bit of relief after a rough stretch. Over the past day, the SEI price has pushed higher and reclaimed levels it recently lost, which naturally stands out in a market that’s still feeling cautious overall.
That said, this move doesn’t look like a full trend change just yet. The SEI chart indicates buyers stepped in at a familiar support zone, triggering a bounce, but whether that bounce can turn into something bigger is still an open question.
- A Familiar SEI Support Zone Does Its Job
- Ecosystem Updates Help the Story, Not the Price
- The Bigger Market Still Feels Cautious
- What’s Next for SEI?
A Familiar SEI Support Zone Does Its Job
The SEI price rebound started near the $0.106 level, an area that has held up as support more than once. When price dipped into that zone again, buyers showed up quickly, helping SEI climb back above $0.110.
This type of move usually points to short-term traders reacting to levels rather than long-term investors stepping in. The RSI sitting around 38 supports that idea, showing there’s still room for upside without the market being overheated.
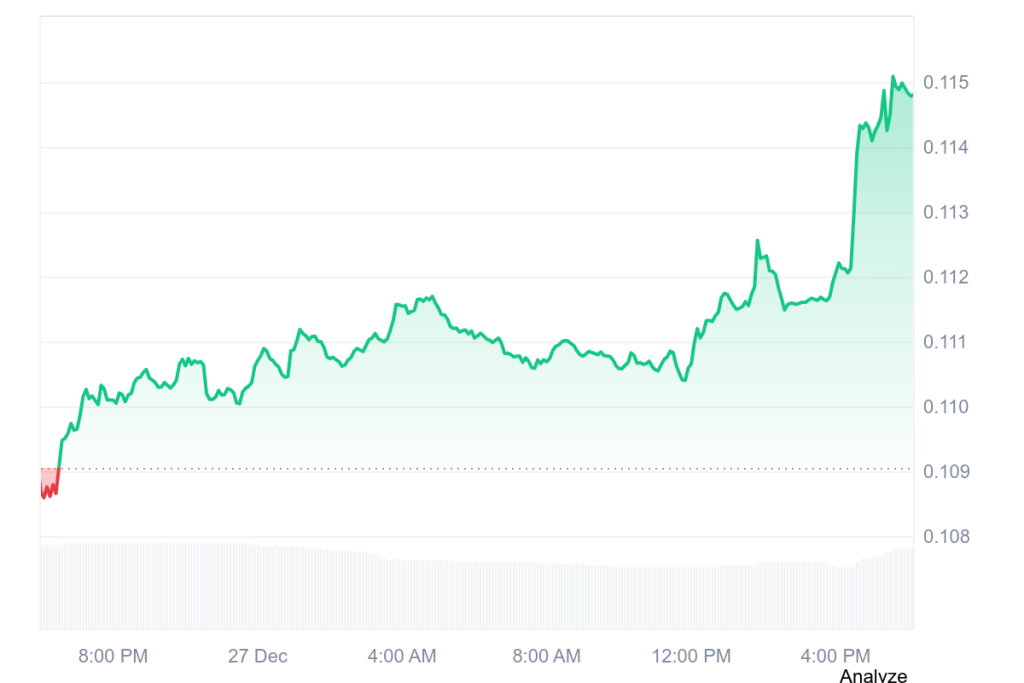
Source: CoinMarketCap/SEI
For now, the SEI price is pressing toward the $0.115 area, which is the next level traders are watching. The big picture is still about the same. The price sits under the 30-day moving average around $0.125, keeping the overall trend pressured.
Ecosystem Updates Help the Story, Not the Price
There was also some ecosystem news in the background. On December 25, Wormhole rolled out its Market Infrastructure Grid on Sei, connecting stablecoins like USDC and USDT with tokenization platforms such as Ondo and Securitize.
From a longer-term perspective, this fits well with Sei’s push toward institutional-grade infrastructure. It’s a positive step, but the market reaction was fairly muted. That indicates traders want to see real adoption before assigning much value to the update.
So far, on-chain activity, including TVL and transaction volume, hasn’t shown a meaningful jump, which limits how much this news can move price in the short term.
Read Also: Why Is Bitcoin Price Dipping? AI Says $75K Would Still Be Structurally Bullish
The Bigger Market Still Feels Cautious
Meanwhile, the SEI price climbed back amidst the wider crypto space inching up modestly, with the total market cap nudging higher; Bitcoin’s share of the market eases off a touch to give altcoins a bit of room to move.
Even so, sentiment remains defensive. The Fear and Greed Index is still deep in fear territory, and SEI’s open interest has dropped by nearly 12% over the past week. That points to traders reducing exposure rather than aggressively betting on a rally.
What’s Next for SEI?
Right now, the SEI price move looks like a technical bounce mixed with some cautious optimism. The most important level to watch is $0.110. Holding above it keeps the short-term recovery alive.
If momentum fades, a pullback toward $0.106 wouldn’t be surprising. For this move to turn into something more meaningful, SEI will need stronger volume and clearer signs of network growth.
Until then, today’s price action looks more like a pause in the downtrend than a confirmed reversal.
Disclaimer: The information on this page may come from third parties and does not represent the views or opinions of Gate. The content displayed on this page is for reference only and does not constitute any financial, investment, or legal advice. Gate does not guarantee the accuracy or completeness of the information and shall not be liable for any losses arising from the use of this information. Virtual asset investments carry high risks and are subject to significant price volatility. You may lose all of your invested principal. Please fully understand the relevant risks and make prudent decisions based on your own financial situation and risk tolerance. For details, please refer to
Disclaimer.
Related Articles
ETH 15-minute pump of 0.71%: spot marginal buy pressure amplifies liquidity, pushing the short-term move higher
2026-04-09 17:00 to 2026-04-09 17:15 (UTC), the ETH price fluctuated in the range of 2207.09 to 2224.42 USDT, recording a positive return of +0.71%, with an amplitude of 0.78%. The short-term price increase attracted market attention. Although overall sentiment remains relatively cautious, volatility in the spot market has increased.
The main driving force behind this move was that the spot market saw marginal active buy orders amid a backdrop of tighter derivatives conditions and an overall contraction in liquidity. As ETH perpetual contract open interest and trading volume both saw a clear decline (within 24 hours, it c
GateNews2m ago
XRP Eyes $1.60 as April History Shapes Market Expectations
Key Insights:
XRP historical April data shows sharp gains and losses, with 2021 marking a 180% surge while recent years reflect declining monthly performance trends.
Current price consolidation between $1.28 and $1.36 suggests reduced volatility, signaling a potential breakout as traders mon
CryptoNewsLand39m ago
Mainstream CEX and DEX funding-rate displays suggest an increasingly bearish market sentiment
On April 10, the Bitcoin price broke through $72k again. According to Coinglass data, the funding rates on major trading platforms show that the market’s bearish sentiment is strengthening. Funding rates are used to balance the contract price with the asset price; a rate below 0.005% indicates that the market is broadly bearish.
GateNews42m ago
Cardano Price Holds Gains as Bullish Signals Strengthen
Key Insights
Cardano trades above $0.25 as steady recovery continues, supported by improving sentiment and growing engagement across crypto discussions among market participants globally.
Derivatives data show rising long positions and positive funding rates, indicating traders
CryptoNewsLand43m ago
XRP Struggles Below $1.35 as Bearish Signals Build
XRP is under significant selling pressure after repeated rejections at resistance around $1.35. Weak momentum indicators and rising short interest suggest increased downside risk, with critical support at $1.30-$1.28. A break below this level could lead to further declines.
CryptoNewsLand48m ago
BTC 15-minute pump of 1.03%: integer-level breakout and macro risk-hedging resonance amplifying the move
From 2026-04-09 15:30 to 15:45 (UTC), the BTC return rate recorded +1.03%, with the price ranging from 71,291.5 to 72,226.9 USDT, and the amplitude reaching 1.31%. During the abnormal move, market attention rose rapidly, volatility noticeably intensified, and prompted investors to closely watch short-term trends.
The main driver behind this abnormal move was BTC breaking through the 72,000 USDT integer level at 15:34, which directly activated some algorithmic trading and drew short-term funds in. The rapid breakout above this key price level boosted spot and derivatives trading volumes in the short term
GateNews1h ago
