Polkadot (DOT) has experienced a prolonged downtrend since March 2025. However, in the past week, DOT unexpectedly gained 4.41% — a notable short-term improvement signal. This development becomes especially significant as the cryptocurrency market remains under strong pressure from Bitcoin (BTC)'s unpredictable fluctuations, along with prevailing cautious sentiment and investor apprehension across the entire market.
Analyzing DOT trend across multiple timeframes
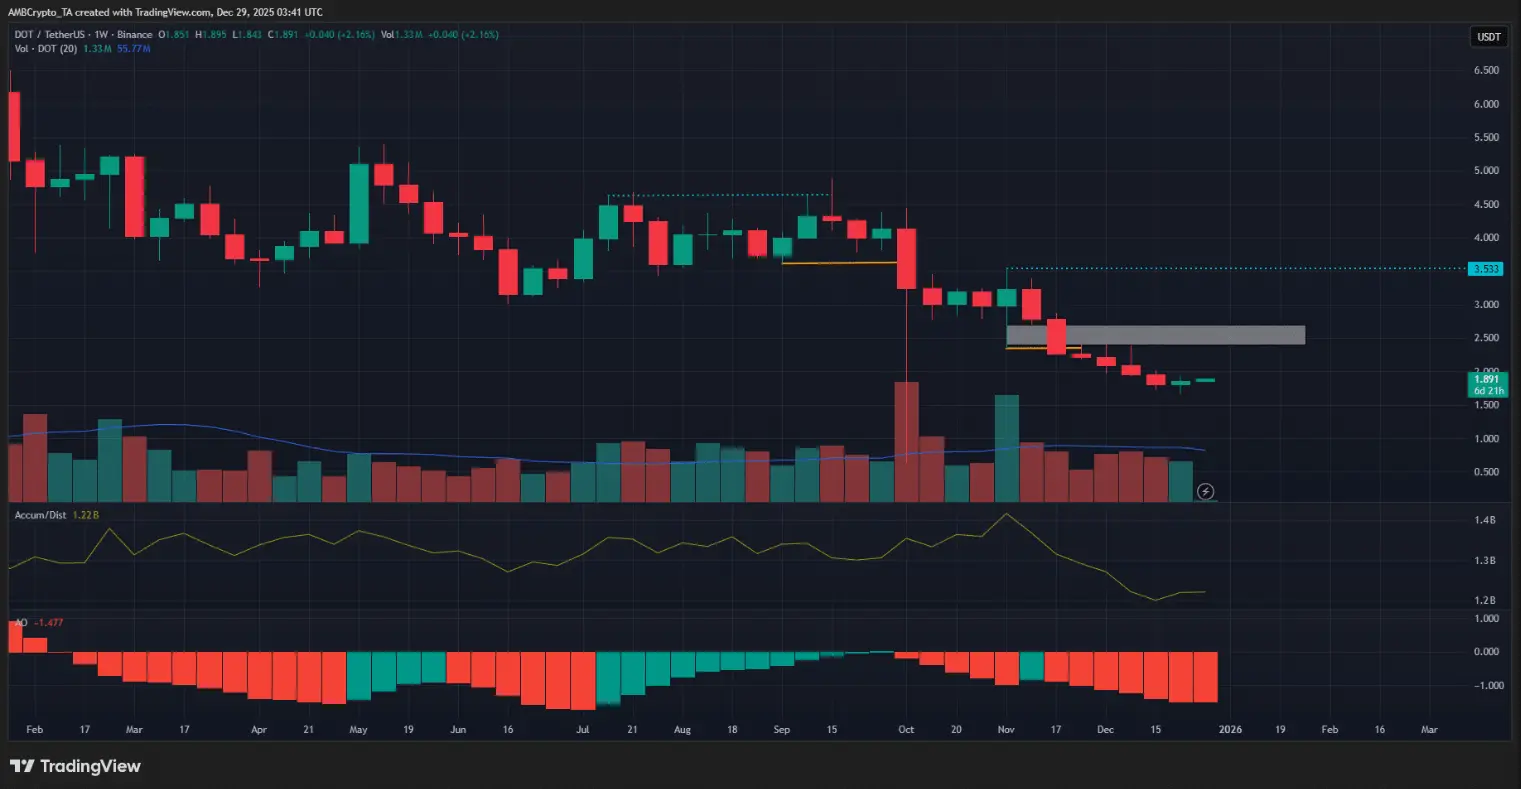
At the time of writing, Polkadot’s weekly trend still maintains a bearish tone. Breakdown points of the downtrend structure (orange) have appeared since September, while the oscillating structure on the weekly chart has continuously leaned toward a downtrend since March.
The A/D indicator reflects stable selling pressure, while the Awesome Oscillator emphasizes strong bearish momentum. The imbalance zone around $2.5 (white box) is considered a potential supply area, which could influence the price before DOT continues its decline on this timeframe.
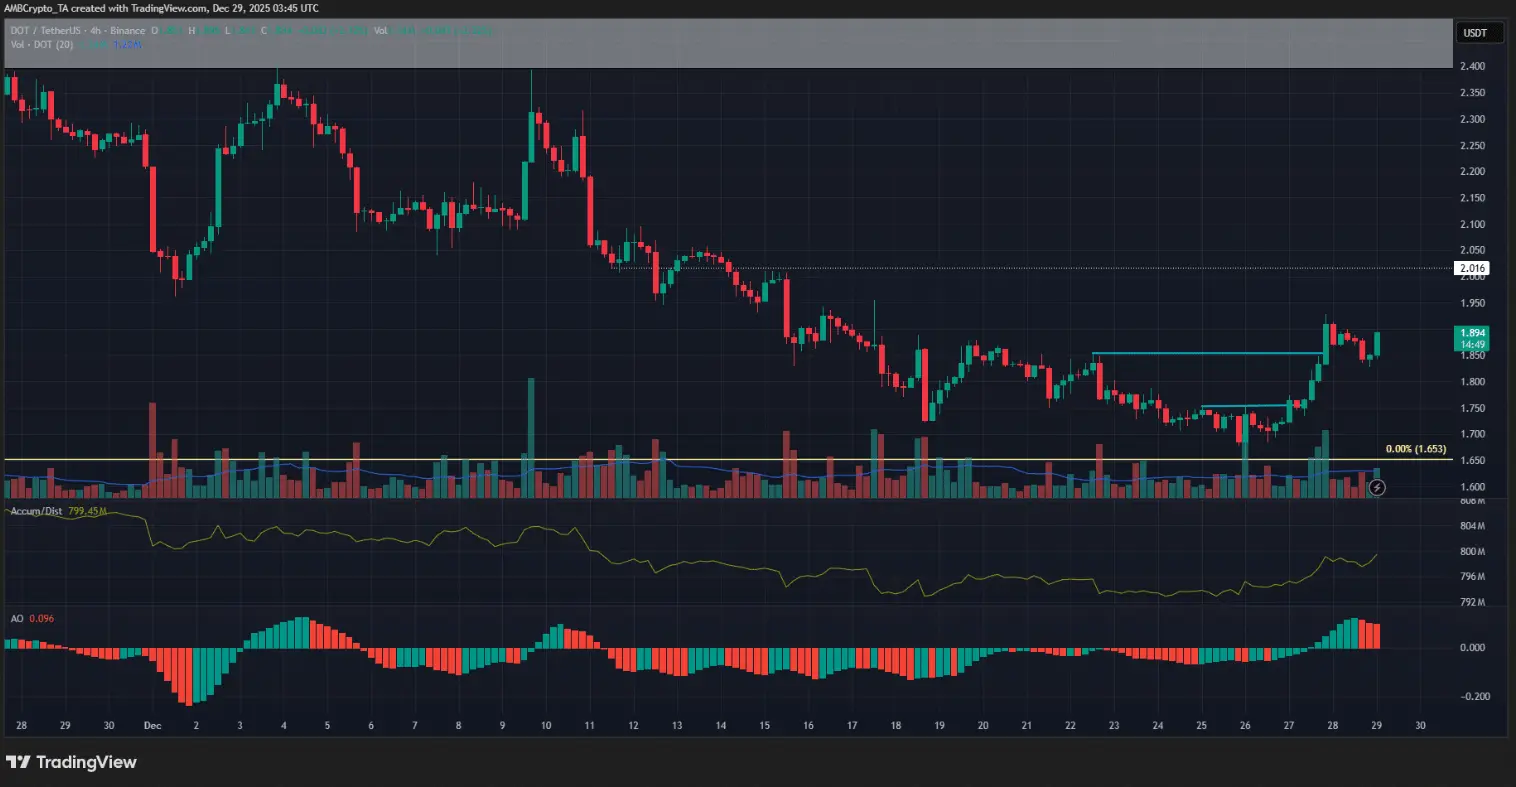
 Weekly DOT/USDT chart | Source: TradingViewMeanwhile, on the 4-hour chart, the bullish reversal trend has become clear over the past week. Two structure-breaking points of the upward trend were recorded when previous lows at $1.75 and $1.85 (blue) were broken.
The A/D indicator is rising, and the Awesome Oscillator shows increasing bullish momentum. The short-term upward trend on H4 could push DOT toward the psychological resistance level of $2, or even target the weekly supply zone around $2.5.
 4-hour DOT/USDT chart | Source: TradingView## Risks for DOT bulls
The resistance zone around $90,000 has become a strong barrier for Bitcoin in recent weeks. Although market liquidity has surged, BTC traders still need to exercise extreme caution. This also means that altcoins like Polkadot may face difficulties breaking out without support from sustainable demand.
On H4 and lower timeframes, current momentum favors the bulls. However, this short-term trend does not imply that the trend on higher timeframes will reverse. Long-term investors should closely monitor this rebound to make informed decisions.
Trader actions – Potential profit from the rebound
Cautious traders may choose to stay on the sidelines as the trend on higher timeframes remains bearish. On the H4 chart, the current upward momentum could reach $2.11. The 30-day liquidation map shows strong pressure from accumulated Short positions, laying the groundwork for the next rally.
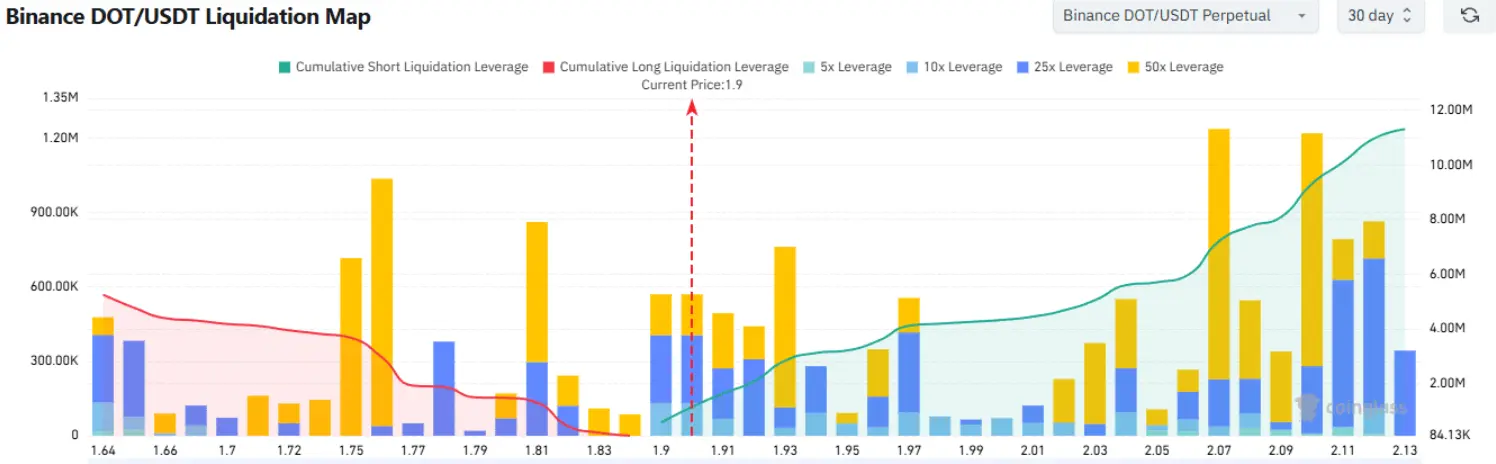 Source: CoinGlass The $2.11 target is attractive due to its proximity to a key liquidity zone. Traders might consider taking profits around $2.0–$2.1 to optimize gains. Conversely, if the price drops below $1.82, setting a Long order will become invalid, signaling a risk that traders should be aware of.
Disclaimer: The information on this page may come from third parties and does not represent the views or opinions of Gate. The content displayed on this page is for reference only and does not constitute any financial, investment, or legal advice. Gate does not guarantee the accuracy or completeness of the information and shall not be liable for any losses arising from the use of this information. Virtual asset investments carry high risks and are subject to significant price volatility. You may lose all of your invested principal. Please fully understand the relevant risks and make prudent decisions based on your own financial situation and risk tolerance. For details, please refer to
Disclaimer.
Related Articles
Ascending Triangle Breakout Loading? Top 5 Altcoins With 5x Upside Potential
Ascending triangles indicate growing buying pressure but need to be confirmed.
Toncoin and Fantom display better trends than others in consolidation.
Overall market conditions still play a crucial role in the success of breakouts.
A common technical pattern has begun to emerge among
CryptoNewsLand6m ago
Crypto Fear and Greed Index Rises to 47, Signaling Neutral Market Sentiment
Gate News message, April 27 — According to Alternative.me, the Crypto Fear and Greed Index stands at 47 today, indicating a neutral market sentiment. The index rose from 33 yesterday (April 26), reflecting a shift toward more balanced market
GateNews1h ago
Whale pension-usdt.eth's $110M Short on BTC and ETH Down $15.25M as April Rally Continues
Gate News message, April 27 — According to on-chain analyst Yujin's monitoring, whale pension-usdt.eth opened a 3x leveraged short position on $110 million worth of BTC and ETH near the start of April, but has since incurred a floating loss of $15.25 million as prices rallied throughout the month.
GateNews1h ago
BNB Price Steady Above $633 as Bulls Face Strong Barriers
Key Insights:
BNB holds above the 50-day EMA near $633, supported by whale activity, while mixed derivatives data keep price action within a consolidation range.
Technical indicators, including RSI and MACD, show mild bullish momentum, though strong resistance levels near $662 and $680
CryptoNewsLand6h ago
Chainlink Price Tightens as $10 Resistance Holds Firm
Key Insights:
Chainlink trades between $8.5 and $10 as a tightening range signals volatility expansion, with buyers showing early strength through higher lows formation.
Open interest drops to $380 million while persistent spot outflows indicate cautious sentiment, though declining selling p
CryptoNewsLand6h ago
Solana Eyes $87 Breakout as Bullish Signals Strengthen
Solana sits near key resistance around $87 as on-chain activity and positive funding buoy bullish momentum; whale-led demand in derivatives supports a potential breakout. RSI >50 and positive MACD indicate rising upside, with a path toward $92–$97 and support near $77.
CryptoNewsLand6h ago