Polkadot (DOT) has experienced a prolonged downtrend since March 2025. However, in the past week, DOT unexpectedly gained 4.41% — a notable short-term improvement signal. This development becomes especially significant as the cryptocurrency market remains under strong pressure from Bitcoin (BTC)'s unpredictable fluctuations, along with prevailing cautious sentiment and investor apprehension across the entire market.
Analyzing DOT trend across multiple timeframes
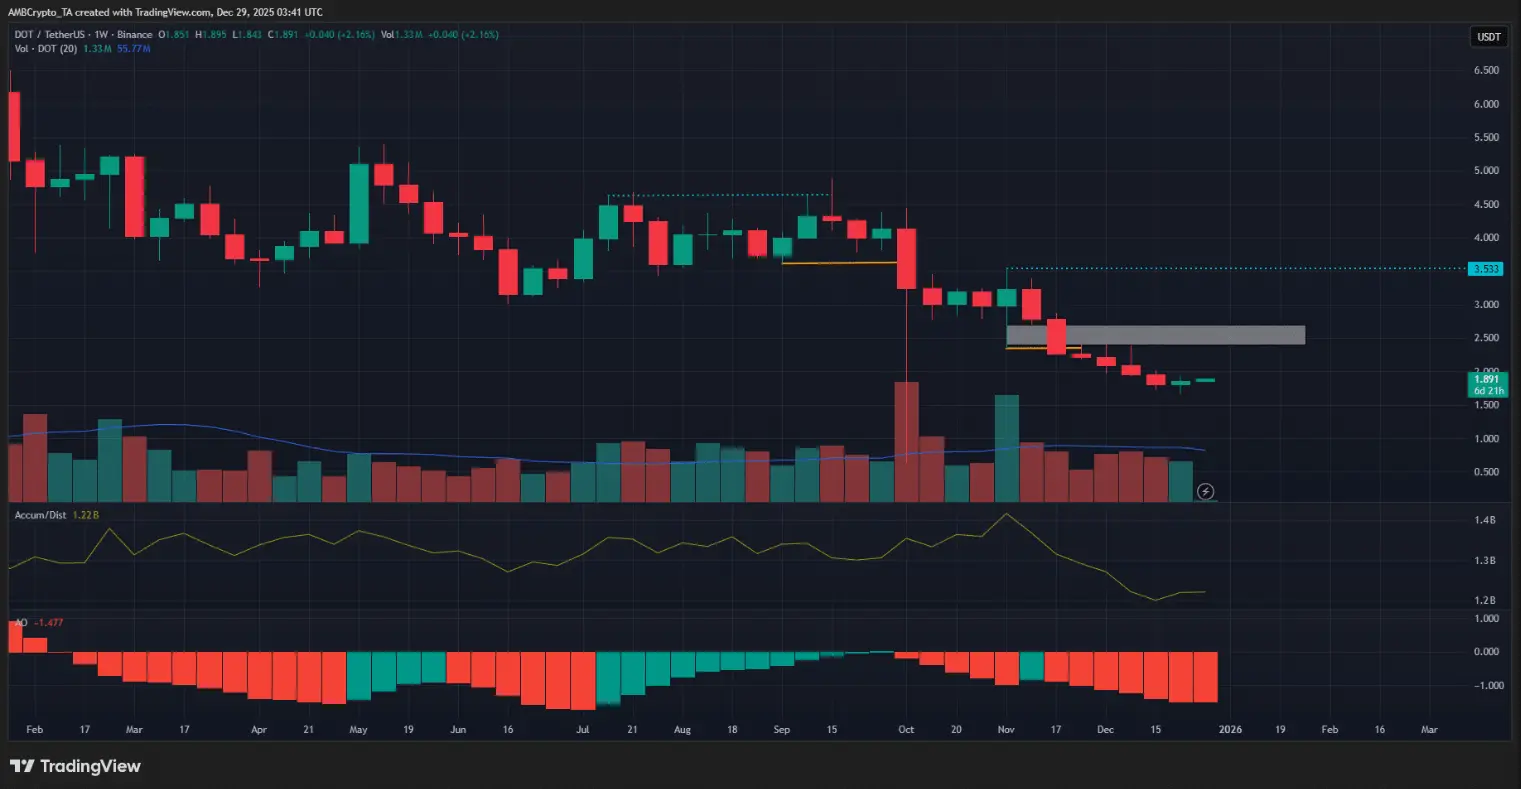
At the time of writing, Polkadot’s weekly trend still maintains a bearish tone. Breakdown points of the downtrend structure (orange) have appeared since September, while the oscillating structure on the weekly chart has continuously leaned toward a downtrend since March.
The A/D indicator reflects stable selling pressure, while the Awesome Oscillator emphasizes strong bearish momentum. The imbalance zone around $2.5 (white box) is considered a potential supply area, which could influence the price before DOT continues its decline on this timeframe.
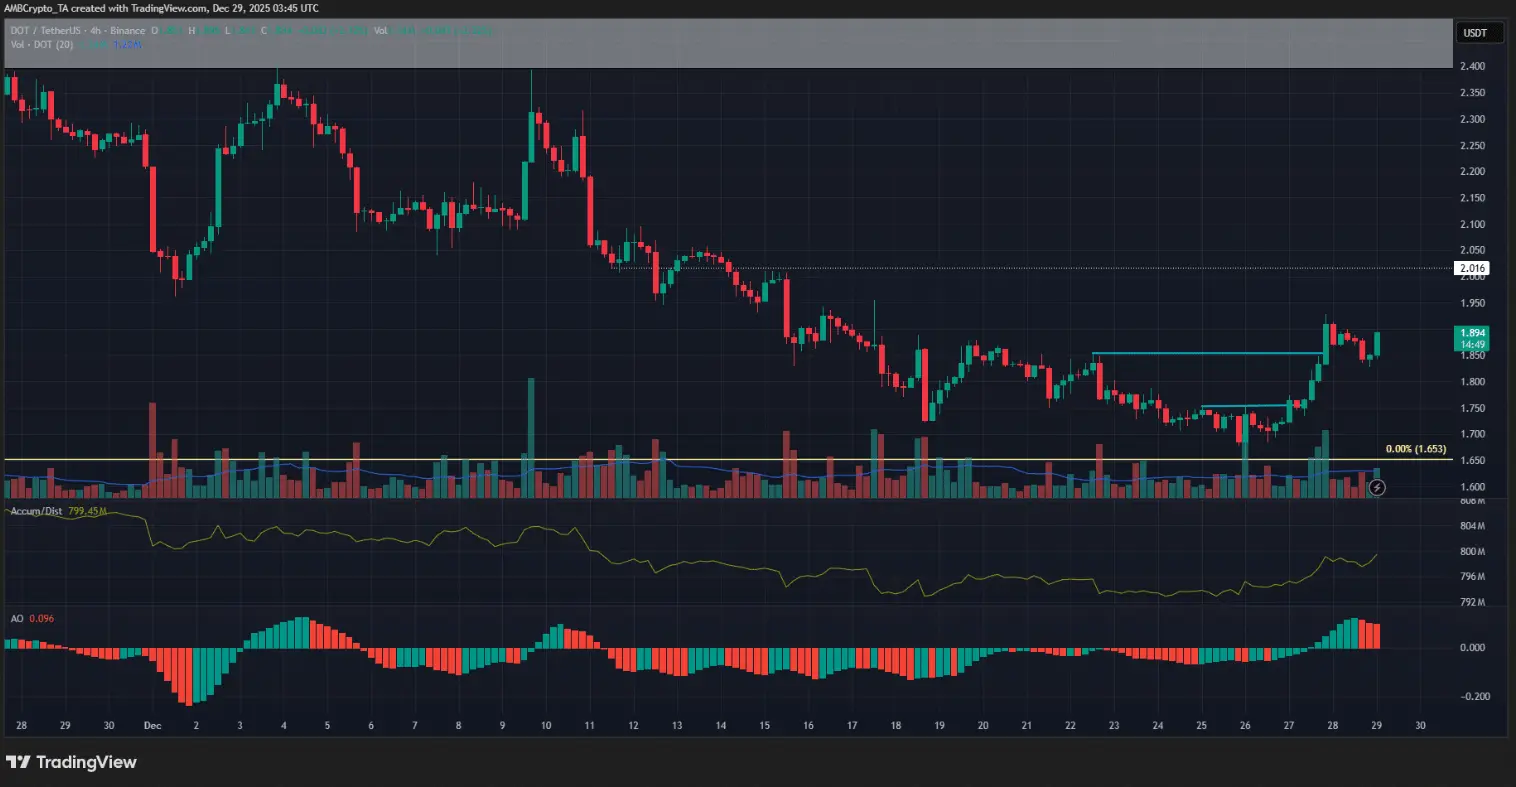
 Weekly DOT/USDT chart | Source: TradingViewMeanwhile, on the 4-hour chart, the bullish reversal trend has become clear over the past week. Two structure-breaking points of the upward trend were recorded when previous lows at $1.75 and $1.85 (blue) were broken.
The A/D indicator is rising, and the Awesome Oscillator shows increasing bullish momentum. The short-term upward trend on H4 could push DOT toward the psychological resistance level of $2, or even target the weekly supply zone around $2.5.
 4-hour DOT/USDT chart | Source: TradingView## Risks for DOT bulls
The resistance zone around $90,000 has become a strong barrier for Bitcoin in recent weeks. Although market liquidity has surged, BTC traders still need to exercise extreme caution. This also means that altcoins like Polkadot may face difficulties breaking out without support from sustainable demand.
On H4 and lower timeframes, current momentum favors the bulls. However, this short-term trend does not imply that the trend on higher timeframes will reverse. Long-term investors should closely monitor this rebound to make informed decisions.
Trader actions – Potential profit from the rebound
Cautious traders may choose to stay on the sidelines as the trend on higher timeframes remains bearish. On the H4 chart, the current upward momentum could reach $2.11. The 30-day liquidation map shows strong pressure from accumulated Short positions, laying the groundwork for the next rally.
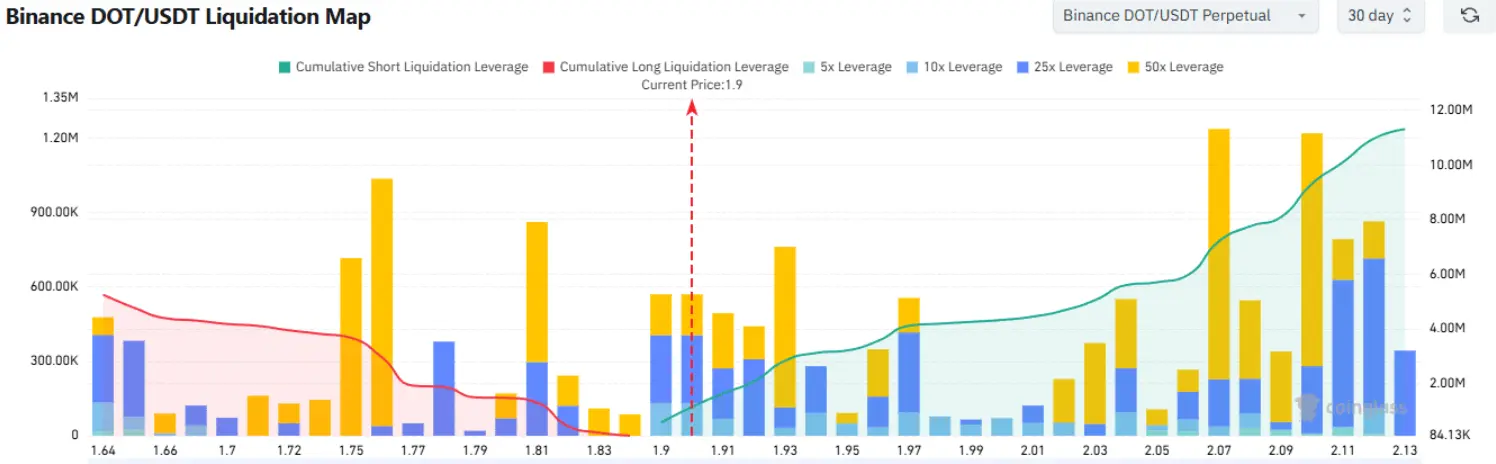 Source: CoinGlass The $2.11 target is attractive due to its proximity to a key liquidity zone. Traders might consider taking profits around $2.0–$2.1 to optimize gains. Conversely, if the price drops below $1.82, setting a Long order will become invalid, signaling a risk that traders should be aware of.
Disclaimer: The information on this page may come from third parties and does not represent the views or opinions of Gate. The content displayed on this page is for reference only and does not constitute any financial, investment, or legal advice. Gate does not guarantee the accuracy or completeness of the information and shall not be liable for any losses arising from the use of this information. Virtual asset investments carry high risks and are subject to significant price volatility. You may lose all of your invested principal. Please fully understand the relevant risks and make prudent decisions based on your own financial situation and risk tolerance. For details, please refer to
Disclaimer.
Related Articles
ETH 15-minute increase of 0.64%: Short-term capital inflows and sentiment shifts drive price fluctuations
2026-04-07 22:00 to 22:15 (UTC), the ETH price ranged between 2145.02 and 2165.83 USDT, and the 15-minute candlestick return reached +0.64%, with a trading range (amplitude) of 0.97%. Market volatility increased and attention rose, indicating short-term activity driven by rapid capital flows.
The main driving force behind this unusual move is that, in the short term, some funds flowed into ETH. Investors are focusing on ETH mainnet assets, and buying interest increased, pushing spot prices higher. At the same time, DeFi and stablecoin-related trading remained active, boosting on-chain liquidity and helping to support a
GateNews44m ago
BTC 15-minute jump of 0.52%: institutional capital inflows and derivatives leverage driving market upside
2026-04-07 22:00 to 2026-04-07 22:15 (UTC), BTC recorded a 15-minute K-line return of +0.52%, with a trading range of 69,919.3 to 70,561.1 USDT and a swing of 0.92%. This bout of abnormal movement occurred against the backdrop of BTC breaking through the $70,000 level, rising market attention, and heightened short-term volatility.
The main driving force behind this abnormal move was the inflow of large-scale institutional funds and a synchronized buy-side response tied to ETFs. Among them, an ETF product under a global asset management giant transferred 1,1
GateNews44m ago
XRP Stabilizes Near Key Levels Amid Fed Pressure and Rule Shift
Key Insights
XRP stabilized near $1.31 as macroeconomic pressures and declining liquidity combined to limit recovery momentum and increase short-term volatility risks significantly.
Proposed stablecoin regulations favor utility models, positioning RLUSD for growth while reducing incentives t
CryptoNewsLand1h ago
BTC 15-minute up 0.98%: Whale transfers surge in tandem with geopolitical hedging demand
2026-04-07 21:00 to 21:15 (UTC), the BTC price saw a clear spike. The candlestick return rate recorded +0.98%, and the price range was 69309.9-70214.9 USDT, with a 1.31% amplitude. Short-term market volatility increased, participation interest rose, and trading volume and the number of active entities increased in parallel.
The main driver behind this move was whale trading activity. On-chain data shows that the transfer volume to exchanges by whale entities holding more than 1,000 BTC surged before and after the event window. Over the past 24 hours, whale inflow reached 10,5
GateNews1h ago
GLMR Rockets 19.44% as Altcoin Rally Gains Momentum
Moonbeam (GLMR) surged 19.44% to $0.0129 amid increased trader interest, driven by broader cryptocurrency trends and market participation. Analysts note potential for continued growth as resistance levels are closely monitored.
Coinfomania2h ago
SHIB Holds Weak Range as Burn Rate Drops and Pressure Builds
Key Insights
SHIB remains within a long-standing descending channel, with price stuck in the lower range and unable to break persistent resistance levels.
The burn rate dropped sharply, removing a short-term support factor and reducing retail-driven momentum seen earlier during increased
CryptoNewsLand3h ago
