
Date: Sun, Dec 28, 2025 | 11:20 AM GMT
The broader cryptocurrency market is showing modest strength, with both Bitcoin (BTC) and Ethereum (ETH) trading in the green. This steady performance among major assets has helped stabilize overall market sentiment, creating room for select altcoins — including Worldcoin (WLD) — to develop constructive technical setups.
At the time of writing, WLD is trading with a modest intraday gain. More importantly, a notable whale accumulation combined with an improving lower-timeframe structure suggests that momentum may be shifting in favor of the bulls.
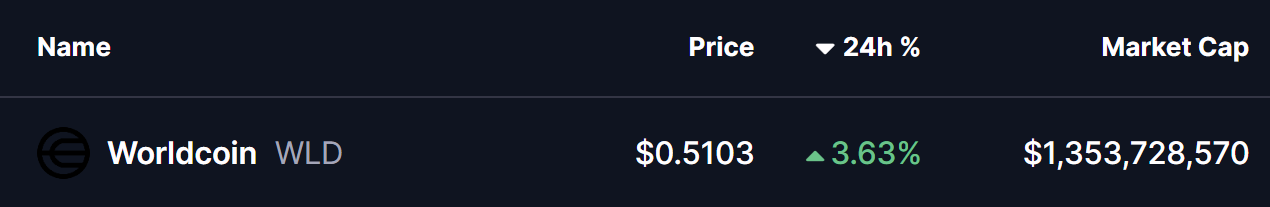
Source: Coinmarketcap
Major Accumulation
On-chain data has added an extra layer of confidence to WLD’s current setup. According to Lookonchain, on December 25, a wallet (0xf000) linked to Multicoin Capital spent $30 million USDC to acquire 60 million WLD at an average price of $0.50 through an OTC deal.
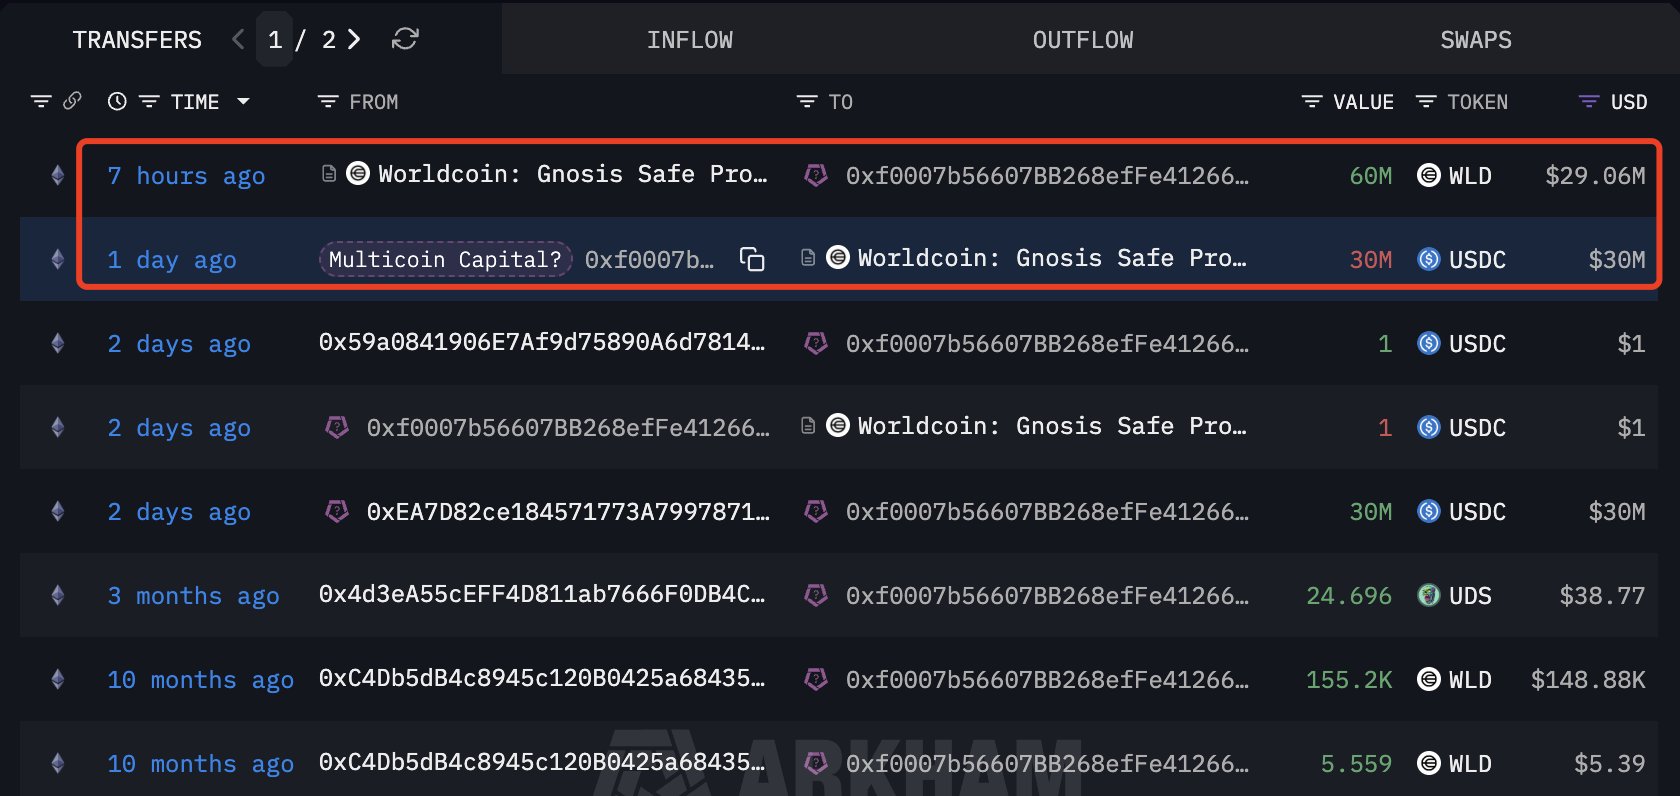
Source: @lookonchain (X)
Such large-scale accumulation near key support levels often signals long-term conviction rather than short-term speculation.
Adam and Eve Pattern in Play
On the 4-hour chart, WLD is forming a textbook Adam and Eve double bottom pattern — a bullish reversal structure that frequently marks the end of downtrends.
The pattern began after WLD faced rejection from the $0.5202–$0.5290 resistance zone. The initial decline was sharp and aggressive, forming the V-shaped “Adam” bottom near the $0.47 region. This was followed by a second, more rounded decline — the “Eve” portion — which bottomed at a similar price level, reinforcing strong demand in that zone.
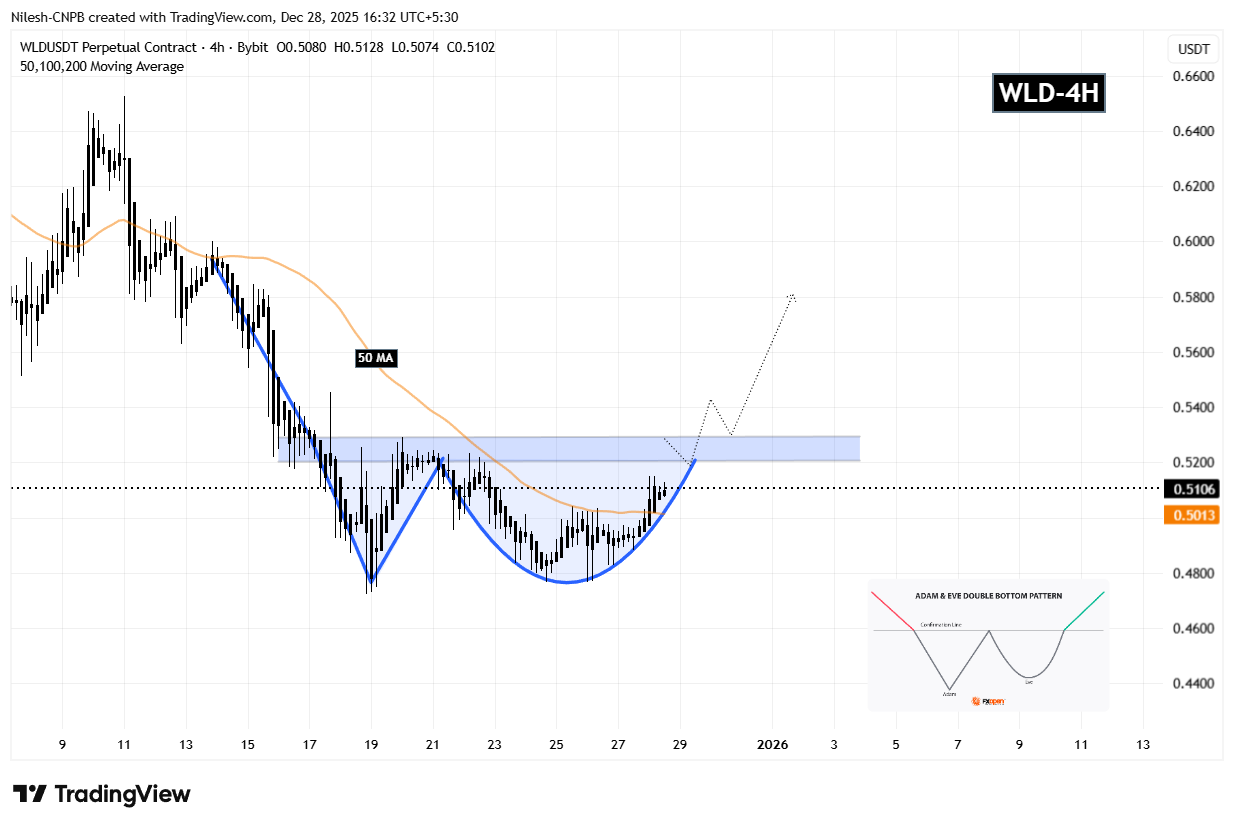
Worldcoin (WLD) 4H Chart/Coinsprobe (Source: Tradingview)
Since completing the second bottom, WLD has steadily pushed higher, reclaimed the 50-period moving average, and is now carving out the right side of the structure near $0.5106. Price is currently pressing against the neckline area, signaling that a decisive move may be approaching.
What Next for WLD?
If WLD continues to hold above the 50 MA support near $0.5013, the bullish structure remains intact. A clean breakout above the $0.5290 neckline, ideally followed by a successful retest, would confirm the Adam and Eve pattern.
Once confirmed, the projected measured move points toward the $0.58 region, suggesting a potential upside of roughly 13% from current levels. This aligns closely with the projected path shown on the chart and would mark a meaningful trend shift on the lower timeframe.
On the flip side, failure to hold the 50 MA could delay the breakout scenario and keep WLD range-bound in the near term. As long as that support holds, however, the technical bias remains tilted to the upside.
Disclaimer: The views and analysis presented in this article are for informational purposes only and reflect the author’s perspective, not financial advice. Technical patterns and indicators discussed are subject to market volatility and may or may not yield the anticipated results. Investors are advised to exercise caution, conduct independent research, and make decisions aligned with their individual risk tolerance.
About Author: Nilesh Hembade is the Founder and Lead Author of Coinsprobe, with over 5 years of experience in the cryptocurrency and blockchain industry. Since launching Coinsprobe in 2023, he has been providing daily, research-driven insights through in-depth market analysis, on-chain data, and technical research.

Disclaimer: The information on this page may come from third parties and does not represent the views or opinions of Gate. The content displayed on this page is for reference only and does not constitute any financial, investment, or legal advice. Gate does not guarantee the accuracy or completeness of the information and shall not be liable for any losses arising from the use of this information. Virtual asset investments carry high risks and are subject to significant price volatility. You may lose all of your invested principal. Please fully understand the relevant risks and make prudent decisions based on your own financial situation and risk tolerance. For details, please refer to
Disclaimer.
Related Articles
XRP Breaks Above $1.40 as Spot ETF Inflows Hit $17.6M Milestone
XRP breaks $1.40 after Ripple partnership boosts investor confidence and market momentum.
Spot XRP ETFs record $17.6M inflows, signaling rising institutional demand and interest.
Technical indicators show resistance ahead, with support holding near $1.40 and $1.3840.
Ripple’s XRP is
CryptoNewsLand11m ago
PEPE Reclaims 0.00000400 — Is This 1.8% Move the Start of a Bigger Run?
PEPE rebounds from 0.00000385 support, forming higher lows and stronger bullish structure.
Technical indicators like MACD and RSI show momentum with room for further upside.
Key resistance at 0.00000410; support at 0.00000380 critical for trend continuation.
PepeCoin — PEPE, has
CryptoNewsLand4h ago
ETH drops 0.58% in 15 minutes: derivatives liquidity contraction and proactive position reduction dominate short-term pullback
From 2026-04-19 04:30 to 2026-04-19 04:45 (UTC), within ETH’s 15-minute candlestick chart, the return recorded -0.58%, and the price range was 2321.62 to 2342.04 USDT, with an amplitude of 0.87%. The short-term selloff occurred against a backdrop of increased overall market volatility and a broad decline in the prices of major crypto assets; overall market risk appetite clearly fell, and traders’ wait-and-see sentiment strengthened.
The main driver behind this abnormal move is a sharp contraction in liquidity in the derivatives market and leveraged funds proactively reducing positions. Data shows that over the past 24 hours, the ETH/USD perpetual contract trading volume dropped 67.16% to approximately 74.87 million, open interest edged down 3.33% to 329 million, and liquidation amounts did not expand unusually. This structure indicates that the market lacks the risk of passive cascades; more funds chose to proactively step aside and wait on the sidelines, intensifying short-term selling pressure.
In addition, the long/short structure in which shorts held the upper hand (long/short ratio 47.48%:52.52%) and sentiment synchronization with the panic range reinforced the downward price trend. During the same period, major coins such as BTC and SOL also fell 2%-3.4% in tandem, further showing that this pullback was driven by system-wide risk sentiment. On-chain funds did not show any large abnormal transfers or large-scale liquidations of DeFi protocols; spot and on-chain liquidity remained generally stable, and no sudden system risk resonance was observed.
Current volatility-related risks still need close monitoring, especially as overall risk appetite continues to contract—ETH’s short-term price may face further downside probing. Watch subsequent changes in derivatives trading volume and open interest, extreme shifts in the long/short ratio and funding rate, and promptly monitor on-chain fund flows, large transfers, and any signs of amplified platform net outflows. For more market anomalies and deeper analysis, please continue to follow our upcoming market updates.
GateNews5h ago
Spark Protocol's January delisting of rsETH proves prudent as Aave faces ETH liquidity crisis
Spark Protocol's strategy of delisting low-usage assets and tightening collateral has faced initial backlash but proved wise during market turmoil. While maintaining higher interest rate caps, SparkLend ensures liquidity, unlike Aave, which now faces significant risks.
GateNews6h ago
Request Network (REQ) Surges 23.68% in 15 Minutes, 24-Hour Gain Reaches 116.52%
Request Network (REQ) surged 23.68% in just 15 minutes, reaching $0.152, with a 24-hour rise of 116.52% and trading volume over $8 million. Factors include retail interest and whale accumulation. Resistance at $0.160 and support at $0.122 are under observation.
GateNews7h ago
Solana Price Stalls Near $80 as ETF Outflows Weigh
Solana trades around $80, facing bearish sentiment due to ETF outflows and declining retail participation. Technical indicators show mixed signals, with resistance at $87 and $98, while support at $77 remains critical for stability.
CryptoFrontNews11h ago
