
**Date: **Sat, Jan 03, 2025 | 01:26 PM GMT
As 2026 kicks off, the broader cryptocurrency market is showing renewed stability. Ethereum (ETH) has reclaimed the $3,100 level, and several major altcoins are already beginning to pick up momentum. Against this improving backdrop, Kaspa (KAS) is quietly positioning itself as a potential late mover, with its chart structure starting to flash early bullish signals.
While KAS is trading slightly in the red today and remains mostly flat on the weekly timeframe, the more important story is unfolding beneath the surface. Recent price action suggests a meaningful structural shift may be underway — one that could mark the early stages of a bullish continuation if confirmed.
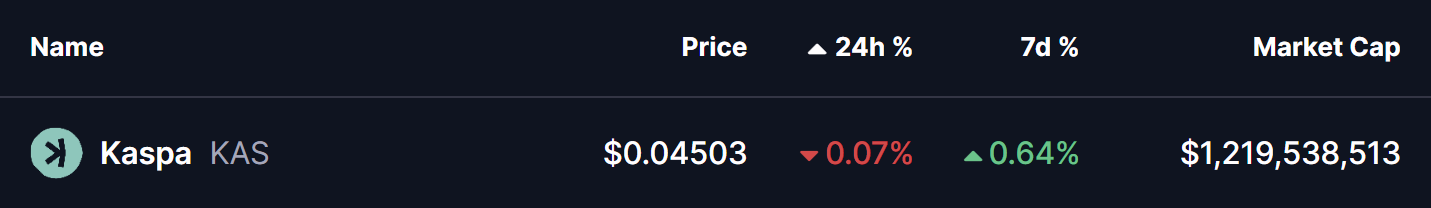
Source: Coinmarketcap
Rounding Bottom in Play
On the 4-hour timeframe, Kaspa appears to be forming a rounding bottom pattern, a classic bullish reversal structure that typically develops after a prolonged corrective phase. This pattern reflects a slow but steady transition from distribution to accumulation, as selling pressure weakens and buyers gradually regain control.
The setup began after KAS faced strong rejection near the $0.06310 neckline zone, which triggered a sharp decline through late November and December. That downside move eventually found strong demand near the $0.040 level, which has since acted as a key support area. Multiple defenses of this zone prevented further downside and helped establish a stable base for a potential trend reversal.
Since carving out that bottom, KAS has started to curve higher in a smooth, rounded fashion — closely matching the textbook structure of a developing rounding bottom. The recent stabilization above the $0.045 region further supports the idea that downside momentum is fading.
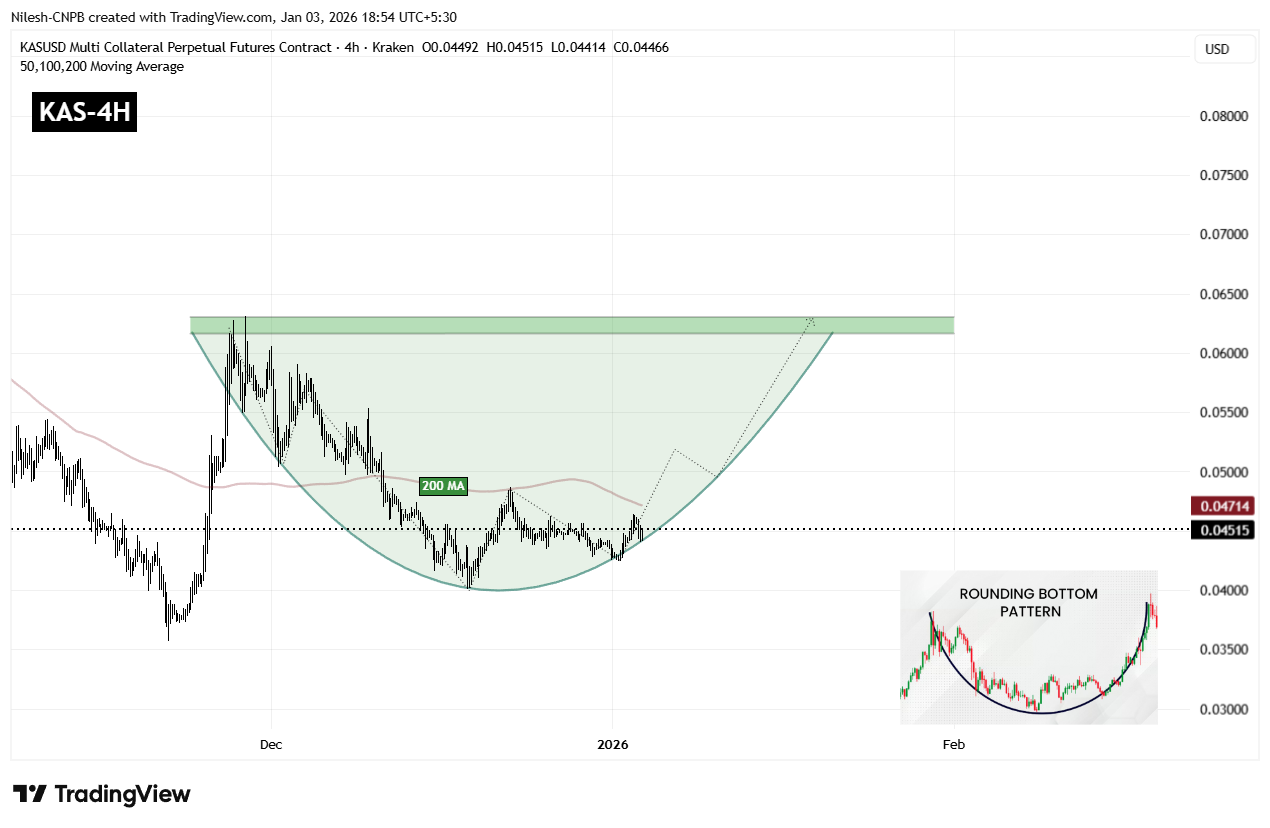
Kaspa (KAS) 4H Chart/Coinsprobe (Source: Tradingview)
A key technical level now comes into focus: the 200-period moving average, currently hovering near $0.04714. This level has acted as dynamic resistance during the recovery phase, and reclaiming it would mark an important shift in short-term market structure.
A sustained move above the 200 MA would indicate that buyers are regaining control after months of corrective price action and could act as the trigger for a stronger upside continuation.
What’s Next for KAS?
For full confirmation of the rounding bottom pattern, KAS must eventually reclaim the $0.06310 neckline resistance. A clean breakout above this zone would validate the entire reversal structure and could open the door to a broader bullish expansion phase, with momentum traders likely re-entering the market.
Until that breakout occurs, the pattern remains in development. Short-term consolidation or shallow pullbacks remain possible, especially near moving average resistance. However, as long as price continues to hold above the $0.04245 support base and maintains higher lows, the broader bottoming structure remains intact and constructive.
In the near term, all eyes remain on the 200 MA and the neckline zone. How Kaspa reacts around these levels will likely determine whether this emerging bullish setup evolves into a confirmed breakout move or requires more time to mature.
Disclaimer: The views and analysis presented in this article are for informational purposes only and reflect the author’s perspective, not financial advice. Technical patterns and indicators discussed are subject to market volatility and may or may not yield the anticipated results. Investors are advised to exercise caution, conduct independent research, and make decisions aligned with their individual risk tolerance.
About Author: Nilesh Hembade is the Founder and Lead Author of Coinsprobe, with over 5 years of experience in the cryptocurrency and blockchain industry. Since launching Coinsprobe in 2023, he has been providing daily, research-driven insights through in-depth market analysis, on-chain data, and technical research.

Disclaimer: The information on this page may come from third parties and does not represent the views or opinions of Gate. The content displayed on this page is for reference only and does not constitute any financial, investment, or legal advice. Gate does not guarantee the accuracy or completeness of the information and shall not be liable for any losses arising from the use of this information. Virtual asset investments carry high risks and are subject to significant price volatility. You may lose all of your invested principal. Please fully understand the relevant risks and make prudent decisions based on your own financial situation and risk tolerance. For details, please refer to
Disclaimer.
Related Articles
ADA Retests Historic Support For 200% Rally
Cardano's price is testing a crucial support zone, historically linked to significant recoveries. Analysts observe potential trend shifts, while market sentiment and broader crypto trends, especially Bitcoin's performance, will be key in determining future price movements.
Coinfomania19m ago
Analyst: Three Key Factors Behind Bitcoin's Price "Outperforming Stocks"
Despite the ongoing Iran-Middle East conflict, Bitcoin's price remains relatively stable at approximately $71,000. Analysis indicates its resilience is supported by geopolitical risk hedging, Federal Reserve policy, and institutional investor interest. However, if it breaks below $67,500, it could form a weakening trend, requiring close attention to relevant market movements.
GateNews44m ago
Bernstein Says Bitcoin Bottom In, Targets $150K in 2026
AllianceBernstein analysts suggest Bitcoin has likely bottomed after a significant decline, with no systemic failures noted. Steady institutional demand and ETF inflows above $56 billion support a bullish $150,000 year-end target, indicating market resilience despite macro pressures.
CryptoFrontNews44m ago
Four On-Chain Indicators Show Weak Demand, Bitcoin Recovery May Face Resistance
This year, Bitcoin has experienced increased price volatility due to geopolitical tensions and economic pressures, with weakening demand evident. On-chain data indicates dispersed wallet activity and reduced whale transactions, reflecting investor caution. Fundamentals continue to deteriorate, limiting short-term recovery prospects, necessitating attention to external factors and policy developments.
GateNews52m ago
Bitcoin Price Surges 10% Then Falls Into Bull Trap? Exchange Inflows Spike Draws Attention
Bitcoin price fluctuates at $70,700, with a monthly gain of approximately 10%. Both retail investors and whales are simultaneously accumulating Bitcoin, with capital inflows surging, yet this may bring selling pressure. The derivatives market shows bullish sentiment, but spot selling pressure could trigger forced liquidations. The key technical support level is at $70,700, and market dynamics require close monitoring.
GateNews1h ago
