As of Tuesday, Sui (SUI) is trading above $1.95, approaching the highest level in the past two months. The upward momentum remains solid after a streak of six consecutive bullish sessions, reflecting widespread optimistic sentiment in the market. Meanwhile, positive signals from on-chain data and derivatives markets continue to support the bullish trend, while technical analysis indicates room for further gains, with a short-term target around the resistance zone of $2.34.
On-chain and derivatives data show increasing market participation
According to data from Santiment, the trading volume of the Sui ecosystem — including the total value of transactions generated by all on-chain applications — surged to $967.43 million on Tuesday, the highest since early December. Notably, this indicator has maintained a continuous upward trend in recent days, indicating renewed interest from traders, and liquidity on the Sui network has also improved significantly. This development helps reinforce the short-term bullish outlook for SUI.
 Sui Trading Volume Chart | Source: Santiment
Meanwhile, data from DefiLlama shows that the Total Value Locked (TVL) on Sui has steadily increased since late December, reaching $1.04 billion on Tuesday. The rising TVL reflects strong capital inflows into the ecosystem, indicating that more users are choosing to deposit and utilize assets on DeFi protocols built on the Sui platform.
Sui Trading Volume Chart | Source: Santiment
Meanwhile, data from DefiLlama shows that the Total Value Locked (TVL) on Sui has steadily increased since late December, reaching $1.04 billion on Tuesday. The rising TVL reflects strong capital inflows into the ecosystem, indicating that more users are choosing to deposit and utilize assets on DeFi protocols built on the Sui platform.
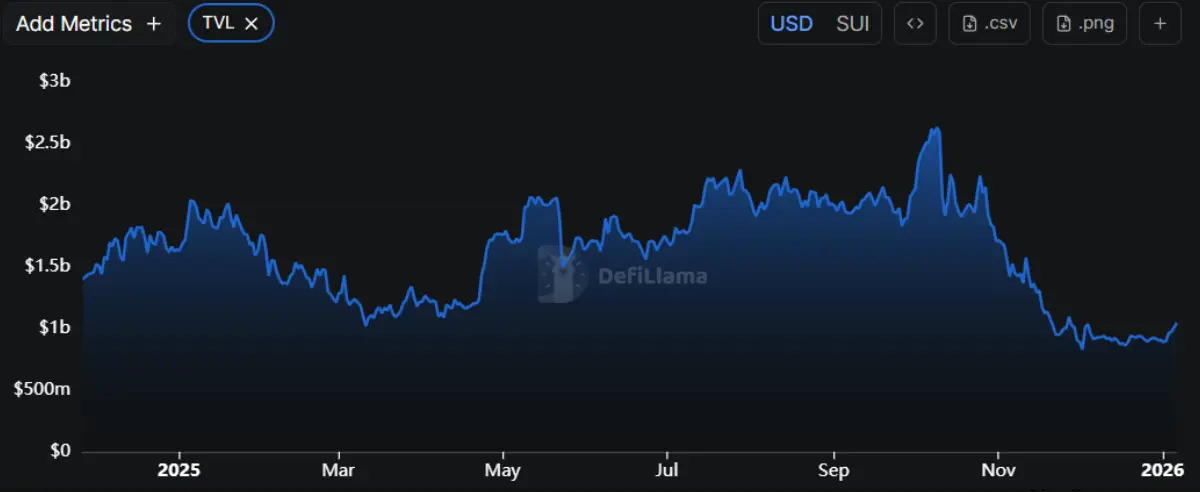 SUI TVL Chart | Source: DefiLlama
In the derivatives market, data from CoinGlass reports that the open interest (OI) in SUI futures contracts has surged to $947.26 million, up from $685 million last week — the highest since October 10. The increase in OI suggests new capital is flowing into the market, indicating growing buying pressure that could continue to drive SUI prices higher in the near future.
SUI TVL Chart | Source: DefiLlama
In the derivatives market, data from CoinGlass reports that the open interest (OI) in SUI futures contracts has surged to $947.26 million, up from $685 million last week — the highest since October 10. The increase in OI suggests new capital is flowing into the market, indicating growing buying pressure that could continue to drive SUI prices higher in the near future.
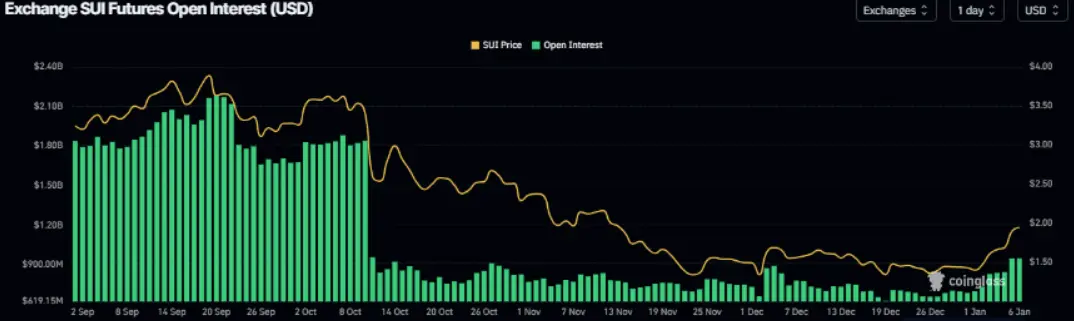 Source: Coinglass
Sui Price Forecast: Bulls Target Above $2.34
Sui price officially broke out of the descending wedge pattern — formed by connecting the peaks and troughs since October — on December 26, recording a gain of over 35% as of Monday. As of Tuesday, SUI remains firmly above $1.94, showing clear buying dominance.
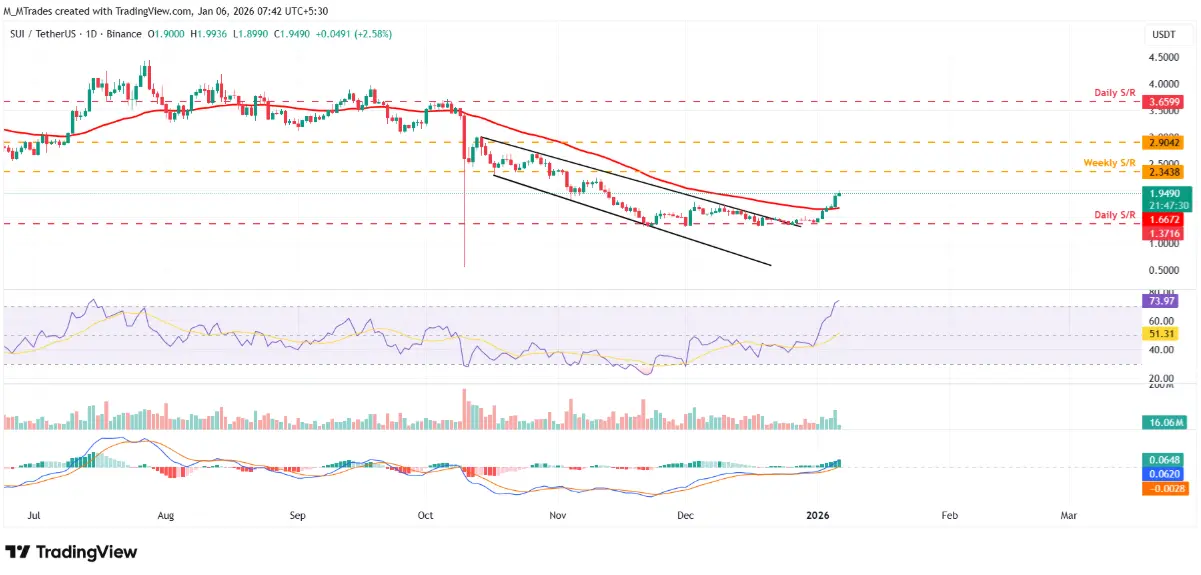 Daily SUI/USDT Chart | Source: TradingView
In a scenario where the uptrend continues, SUI is likely to extend its recovery and target the key resistance zone on the weekly timeframe at $2.34.
Daily SUI/USDT Chart | Source: TradingView
In a scenario where the uptrend continues, SUI is likely to extend its recovery and target the key resistance zone on the weekly timeframe at $2.34.
Technical indicators also support a positive outlook. The RSI on the daily chart reached 73, indicating overbought conditions and strong bullish momentum. Additionally, the MACD has confirmed a bullish crossover, with green histogram bars expanding above the neutral line, further reinforcing short-term bullish signals.
However, in a correction scenario, SUI may face profit-taking pressure and pull back to test the 50-day EMA around $1.66, which acts as the nearest support level.
SN_Nour
Disclaimer: The information on this page may come from third parties and does not represent the views or opinions of Gate. The content displayed on this page is for reference only and does not constitute any financial, investment, or legal advice. Gate does not guarantee the accuracy or completeness of the information and shall not be liable for any losses arising from the use of this information. Virtual asset investments carry high risks and are subject to significant price volatility. You may lose all of your invested principal. Please fully understand the relevant risks and make prudent decisions based on your own financial situation and risk tolerance. For details, please refer to
Disclaimer.
Related Articles
Bitcoin to $90,000? Top Analyst Outlines Bullish Case Following Recent Breakout - U.Today
Bitcoin has achieved a significant breakout, prompting analysts to set aggressive price targets. Will Meade predicts a rise to $90,000 based on current momentum, following a range-bound trading environment and consolidation, indicating bullish trends in the market.
UToday28m ago
Bitcoin Cash Battles $459 Resistance as Massive Sell Walls Stack Toward $650
BCH is trading at $455.86 close to the resistance range of $459.20 with the support level of $447.44.
The chart data indicates that the chart has strong resistance levels at around $520, $580 and $650 which restricts the momentum on short term upside.
Following a sharp fall, price
CryptoNewsLand38m ago
Dogecoin Holds $0.0925 as Traders Recall Historic 12x Surge and Watch $0.09443 Resistance
Dogecoin is trading at $0.0925 which translates to 0.6% increase in the past 24 hours.
The short term range is narrow as support and resistance are located at levels of $0.09173 and $0.09443 respectively.
Historical chart data shows that there
CryptoNewsLand43m ago
Solana Approaches Major Triangle Breakout With $373 Target in Focus
Price action shows a tightening structure between descending resistance and a rising long-term support trendline.
The chart highlights $373.42 as a potential liquidity level if price breaks above the descending resistance.
The rising base trendline continues stabilizing price after the l
CryptoNewsLand1h ago
Cardano (ADA) Holds Top 10 Market Cap Rank as OI Surge Offsets Bears - U.Today
Cardano has regained its position in the Top 10 cryptocurrencies, currently ranking 10th with a market cap of $10.34 billion. The crypto market is experiencing a rally, with Cardano seeing significant volume increases and positive sentiment ahead of its upcoming Van Rossem hard fork.
UToday2h ago
Avalanche (AVAX) stands before a breakthrough opportunity thanks to strong buying power from the bulls
Avalanche (AVAX) has shown a 13% increase over the past week, maintaining trading above $10. Growing interest from individual investors and positive derivatives data indicate a potential bullish trend, despite ongoing geopolitical tensions.
TapChiBitcoin3h ago
