
Date: Fri, Jan 02, 2026 | 10:54 AM GMT
The broader cryptocurrency market has started the new year with modest strength, as both Bitcoin (BTC) and Ethereum (ETH) trade slightly higher with gains of over 2%. This renewed stability across majors has helped improve overall sentiment, allowing several altcoins to regain momentum — including Aster (ASTER).
ASTER is currently trading around 4% higher on the day, but the more important development lies beneath the surface. On lower timeframes, price action is beginning to highlight a constructive bullish structure, suggesting that the token may be preparing for a meaningful breakout if the setup confirms.
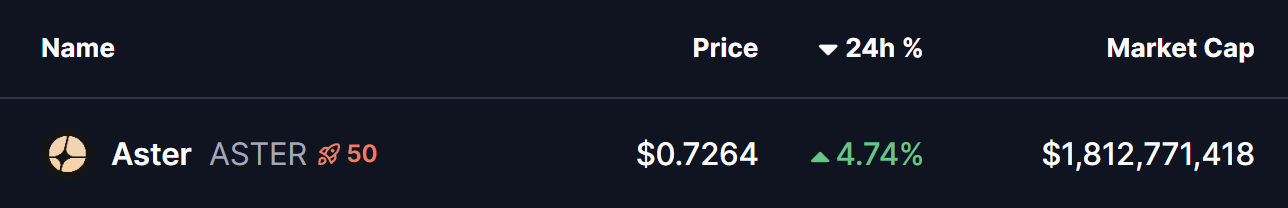
Source: Coinmarketcap
Ascending Triangle Structure Takes Shape
On the 4-hour chart, ASTER is forming a clear ascending triangle, defined by a series of higher lows pressing steadily against a horizontal resistance zone. This type of structure is widely regarded as a bullish continuation pattern, particularly when it develops during consolidation and shows consistent buyer accumulation at rising support levels.
ASTER recently faced rejection near the $0.7367 neckline resistance, which pushed price back toward its ascending support trendline around the $0.68 region. Importantly, each dip has been met with strong buying interest, preventing any deeper pullback and keeping the bullish structure intact. This behavior indicates that sellers are gradually losing control as buyers step in earlier on every retracement.
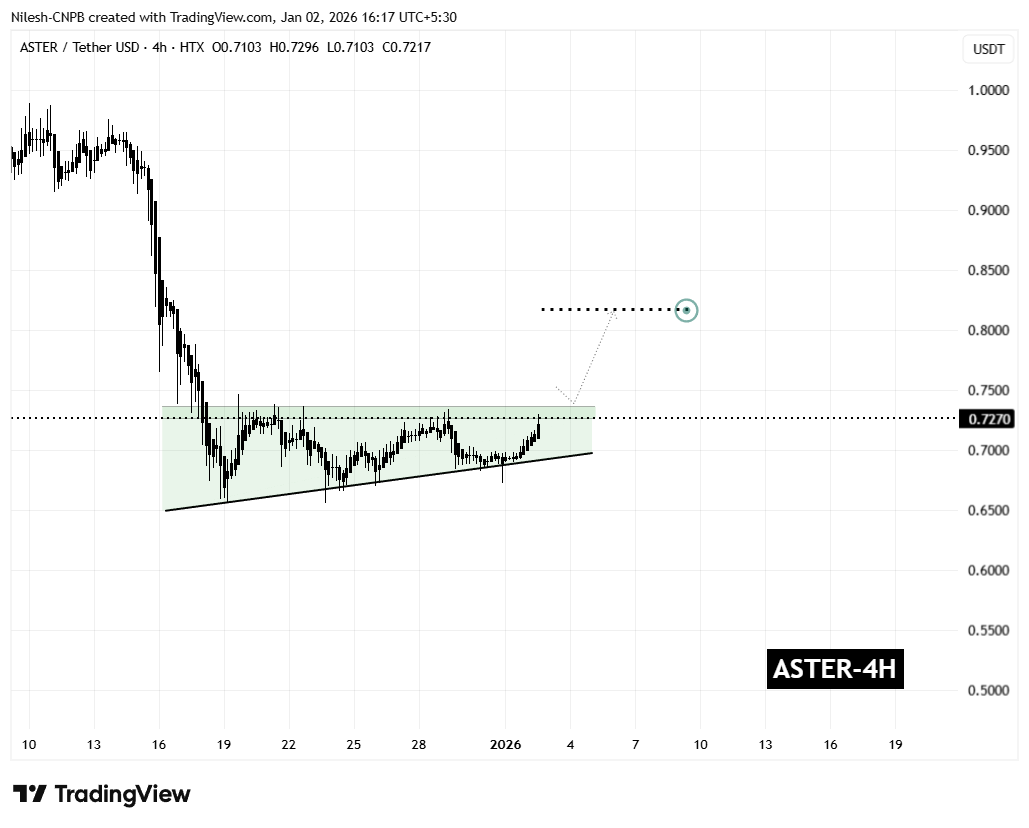
Aster (ASTER) 4H Chart/Coinsprobe (Source: Tradingview)
The latest rebound has once again carried ASTER toward the upper boundary of the triangle, reinforcing the idea that demand remains firm. Rather than signaling weakness, this sideways-to-higher price action reflects healthy consolidation as volatility tightens ahead of a potential breakout.
What’s Next for ASTER?
From here, ASTER appears to be preparing for another test of the $0.7367 resistance zone. A decisive breakout above this level, followed by a sustained close and a successful retest as support, would confirm the ascending triangle pattern and likely trigger a bullish expansion phase.
Based on the measured move of the formation, the technical upside projection points toward the $0.8178 region. This target represents a potential upside of roughly 12% from current levels and also aligns with previous price structure, adding further confidence to the bullish outlook.
That said, caution remains warranted. If ASTER fails to break above resistance, price could once again drift back toward the rising support trendline. As long as this trendline continues to hold, the broader bullish setup remains valid. A decisive breakdown below support, however, would invalidate the pattern and postpone any breakout scenario.
For now, the combination of improving market sentiment, consistent dip-buying, and a tightening ascending triangle structure suggests that Aster is approaching a critical decision point — one that could define its next significant move as 2026 begins.
Disclaimer: The views and analysis presented in this article are for informational purposes only and reflect the author’s perspective, not financial advice. Technical patterns and indicators discussed are subject to market volatility and may or may not yield the anticipated results. Investors are advised to exercise caution, conduct independent research, and make decisions aligned with their individual risk tolerance.
About Author: Nilesh Hembade is the Founder and Lead Author of Coinsprobe, with over 5 years of experience in the cryptocurrency and blockchain industry. Since launching Coinsprobe in 2023, he has been providing daily, research-driven insights through in-depth market analysis, on-chain data, and technical research.
Disclaimer: The information on this page may come from third parties and does not represent the views or opinions of Gate. The content displayed on this page is for reference only and does not constitute any financial, investment, or legal advice. Gate does not guarantee the accuracy or completeness of the information and shall not be liable for any losses arising from the use of this information. Virtual asset investments carry high risks and are subject to significant price volatility. You may lose all of your invested principal. Please fully understand the relevant risks and make prudent decisions based on your own financial situation and risk tolerance. For details, please refer to
Disclaimer.
Related Articles
Analyst Says Bitcoin Indicators Show Early Signs of Market Recovery
Stablecoin liquidity rose by ~$8B since February, signaling potential improved market trading conditions.
Inter-exchange Flow Pulse turned positive, indicating more Bitcoin moving to derivatives platforms.
Long-term holders retain ~79% of supply, showing gradual supply transfers rather
CryptoFrontNews12m ago
Dogecoin at a Turning Point — Will $0.094 Resistance Finally Break?
Dogecoin was trading between $0.0925 and $0.09173 with the price stabilizing around $0.0925.
The immediate $0.09443 resistance caps the current range. A move above this level could expand today’s trading activity.
Past historical price movements coincide with a number of trend support res
CryptoNewsLand1h ago
XRP Breaks $1.40 Resistance as Volume Surge Lifts Momentum
Key Insights
XRP surged past the $1.40 resistance after trading volume climbed nearly 13%, signaling renewed trader interest and stronger short-term momentum.
Ripple’s collaboration with Mastercard through the Crypto Partner program increased market attention as investors anticipate
CryptoNewsLand1h ago
XRP Price Structure Tightens While Heatmap Highlights $1.30 Liquidity Zone
XRP trades near $1.37 support after a 0.9% daily decline, while the $1.44 level remains the immediate resistance in the current range.
A three-week liquidity heatmap highlights a large order cluster around $1.30, indicating a strong liquidity zone below price.
A three-month Gaussian
CryptoNewsLand2h ago
Internet Computer Price Nears Wedge Breakout — Will Momentum Hold Above $2.54?
Internet Computers continues trading within a falling wedge that has developed since November. Price now approaches the pattern’s upper boundary as volatility tightens.
ICP is trading around the $2.57 mark which is a bit higher than the $2.54 support. In the meantime, the immediate
CryptoNewsLand2h ago
Billionaire Investor Stanley Druckenmiller Bullish on Stablecoin Growth
Billionaire investor Stanley Druckenmiller believes stablecoins will become the backbone of the financial system in 10-15 years, citing their efficiency. However, he views much of the wider crypto market as unnecessary, describing it as “a solution looking for a problem.”
Decrypt2h ago