Here’s why Bitcoin is dropping as the Dow Jones hits 49,000 after major stock surges following Maduro’s capture.
The global financial sector is currently in the midst of something unusual.
While traditional stock markets are celebrating new all-time highs, the cryptocurrency market is in the midst of a localized correction. In just three hours this morning, Bitcoin dropped nearly $3,000.
This move erased roughly $80 billion from the total crypto market cap. Notably, this “flash crash” happened exactly as the Dow Jones Industrial Average crossed the 49,000 mark for the first time in history.
Investors are now asking why digital assets are bleeding while the rest of the world’s wealth is expanding.
Understanding the Bitcoin Market Divergence 2026
Historically, Bitcoin tends to copy the same direction as high-growth tech stocks.
When the Nasdaq goes up, Bitcoin follows, but this morning, that old rule was completely broken.
This event shows a change in how different assets react to the news. Traditional markets are currently in a state of “geopolitical euphoria” after the US military capture of Nicolás Maduro over the first weekend of January.
This event has generated a massive rally in energy and industrial stocks. Investors expect a total revival of the Venezuelan oil industry, which has pushed the Dow Jones to its new 49,000 milestone.
Despite this positive mood in stocks, Bitcoin fell from a morning high of $93,800 to a low of $90,800. This drop was not caused by bad news for the blockchain. Instead, it was a “market reset.”
_Related Reading: _****Why Does Bitcoin Always Bleed at 10AM? The Pattern No One’s Explaining
The Anatomy of the 10 AM Slam
The 10:00 AM ET window is a unique time in the trading space. It is when US institutional desks are fully active and European traders are preparing to close their day.
According to market analyst Richard, through his post on LinkedIn, this overlap creates a rise in volume and on January 7, this surge turned into a “leverage washing” event. More than $220 million in leveraged positions were wiped out in less than four hours.
About 85% of these were “long” positions from traders who were betting that Bitcoin would continue its climb toward $100,000.
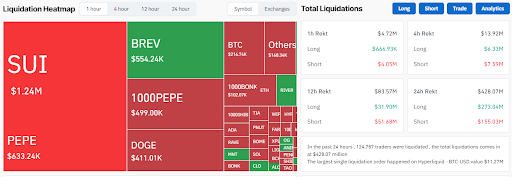
Major liquidations rocked the crypto market in the last 24 hours | source: Coinglass
Equities and Metals Lead the Global Rally
While crypto traders were feeling the pain, the rest of the investment space was thriving. The Dow’s record-breaking run is being led by energy giants.
Chevron (CVX) and Valero (VLO) have seen their shares soar as they prepare for new operations in South America.
The “Venezuela Factor” has also acted as a relief for a sector that struggled with oversupply last year. This trend change from “oversupply” to “growth” has made the “old economy” giants the new stars of Wall Street.
*DOW HITS RECORD, ENERGY STOCKS END HIGHER AFTER US STRIKES VENEZUELA pic.twitter.com/xuZp7I31JU
— Investing.com (@Investingcom) January 5, 2026
Precious metals are also seeing a major bull run. Gold is trading near $4,510 per ounce, while silver has jumped 13% since the start of the year.
This shows that investors are not just seeking risk in stocks; they are also hedging with hard assets. Gold is playing its role as a “ballast” for portfolios. Silver, meanwhile, is entering a “price discovery” phase due to industrial demand.
The fact that Bitcoin is not participating in this rally simply shows that it is currently inside a localised “bear trap.”
Disclaimer: The information on this page may come from third parties and does not represent the views or opinions of Gate. The content displayed on this page is for reference only and does not constitute any financial, investment, or legal advice. Gate does not guarantee the accuracy or completeness of the information and shall not be liable for any losses arising from the use of this information. Virtual asset investments carry high risks and are subject to significant price volatility. You may lose all of your invested principal. Please fully understand the relevant risks and make prudent decisions based on your own financial situation and risk tolerance. For details, please refer to
Disclaimer.
Related Articles
Bitcoin Faces Crucial Supply Test – Understanding the URPD Cluster Near $73,000
The cryptocurrency industry is currently experiencing a very high psychological and technical level of consolidation. Most of the news relating to the market will typically focus on price movement. Well-established analysts are analyzing on-chain statistics to identify the current strength of the pr
BlockChainReporter8m ago
Market is overly panicked? MicroStrategy founder: Bitcoin has already hit bottom, and the quantum threat is needless worry
Michael Saylor asserts that Bitcoin has already finished bottoming at $60k, and he believes concerns about threats from quantum computers are overblown. He predicts that in the future, Bitcoin will become the core of a digital credit system, and he notes that there is limited selling pressure in the market, which could help drive the next bull cycle. Mizuho also has a positive assessment of the company’s future performance.
CryptoCity38m ago
$LINK and $PIPPIN Outshine AI Agent Projects By Social Activity
The article discusses the Top 10 AI Agent Projects in cryptocurrency based on social activity, revealing Chainlink ($LINK) as the leader. It highlights engagement and interaction metrics for various projects, indicating strong interest and demand in the market.
BlockChainReporter3h ago
Ethereum Network Activity Claims New ATH Indicating Bullish Divergence
The Ethereum network has reached a new all-time high in activity, signaling its growing utility beyond speculation. Factors like L2 scaling and DeFi are driving this surge, suggesting strong long-term growth potential for Ethereum ($ETH).
BlockChainReporter3h ago
FLOW Recovers From Prolonged Downtrend As Buy-Side Liquidity Builds, Triggering a Potental 22% Br...
The Flow (FLOW) coin is attracting investor interest as its on-chain market continues to pick up fresh momentum, according to a revelation disclosed today by financial analyst Crypto Patel. As per the data posted today, the cryptocurrency has developed a clear bull structure and is displaying a
BlockChainReporter3h ago
PEPE Price Holds Support as Bearish Bets Build Pressure
Key Insights:
PEPE price stabilizes near strong support despite sustained negative funding rates, highlighting a clear divergence between trader sentiment and actual market behavior.
Declining open interest and reduced liquidation activity indicate leverage reset, suggesting the market has c
CryptoNewsLand4h ago
