
As the new year 2026 begins, the broader cryptocurrency market has shown modest strength over the past few hours, with both Bitcoin (BTC) and Ethereum (ETH) turning slightly green. This improvement in sentiment has started to spill over into the altcoin market as well, with several tokens attempting to build upward momentum — including Render (RENDER).
RENDER is currently up around 4% on the day, but the more compelling development lies beneath the surface. On lower timeframes, price action is beginning to highlight a constructive bullish structure that could soon pave the way for a meaningful breakout if confirmed.
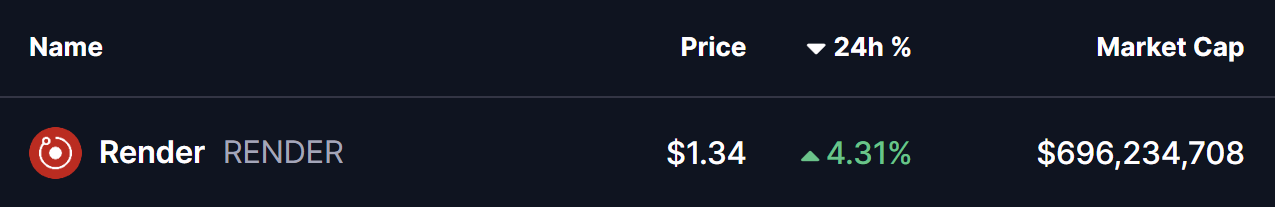
Source: Coinmarketcap
Ascending Triangle Structure Takes Shape
On the 4-hour chart, RENDER appears to be forming a textbook ascending triangle, characterized by a sequence of higher lows pressing steadily against a well-defined horizontal resistance zone. This structure is widely viewed as a bullish continuation pattern, particularly when it develops after a period of consolidation and shows signs of accumulation.
RENDER recently faced rejection near the $1.36 neckline resistance, which pushed price back toward its rising support trendline around the $1.28 region. However, each pullback has been met with strong buying interest, keeping the pattern intact and preventing any deeper breakdown. This behavior suggests that sellers are gradually losing control as buyers continue to step in at higher levels.
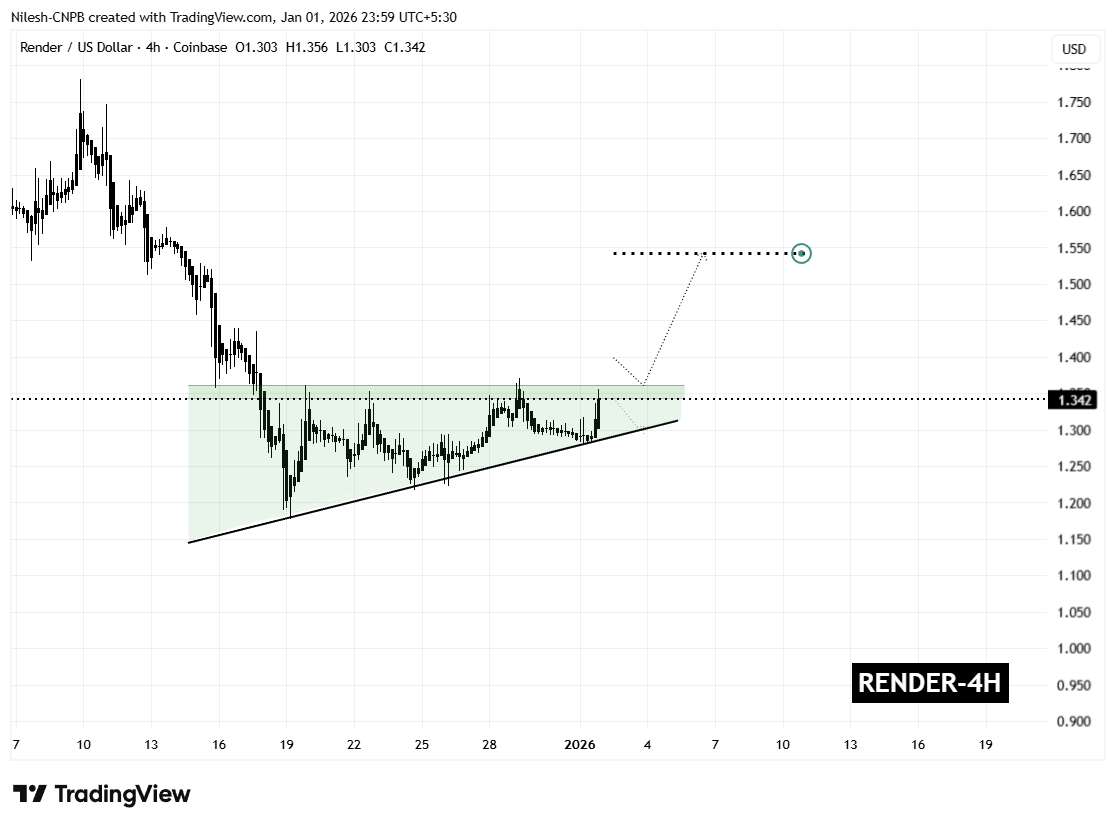
Render (RENDER) 4H Chart/Coinsprobe (Source: Tradingview)
The latest rebound has carried RENDER back toward the upper boundary of the pattern, reinforcing the idea that demand remains firm. Rather than signaling weakness, this price action points to healthy consolidation as the market tightens ahead of a potential breakout.
What’s Next for RENDER?
From here, RENDER appears to be preparing for another test of the $1.36 resistance zone. A confirmed breakout and sustained close above this level, ideally followed by a successful retest as support, would validate the ascending triangle structure and likely trigger a bullish expansion phase.
Based on the measured move of the pattern, the technical upside projection points toward the $1.54 region. This target represents a potential upside of roughly 14% from current levels and also aligns with previous price structure, strengthening the bullish case.
That said, caution remains warranted. A failure to break above resistance could result in a pullback toward the rising support trendline. As long as that trendline continues to hold, the broader bullish structure would remain intact. A decisive breakdown below support, however, would invalidate the pattern and delay any breakout scenario.
For now, the combination of improving market sentiment, persistent buying pressure, and a tightening ascending triangle structure suggests that Render is approaching a critical decision point — one that could define its next significant move as 2026 gets underway.
Disclaimer: The views and analysis presented in this article are for informational purposes only and reflect the author’s perspective, not financial advice. Technical patterns and indicators discussed are subject to market volatility and may or may not yield the anticipated results. Investors are advised to exercise caution, conduct independent research, and make decisions aligned with their individual risk tolerance.
About Author: Nilesh Hembade is the Founder and Lead Author of Coinsprobe, with over 5 years of experience in the cryptocurrency and blockchain industry. Since launching Coinsprobe in 2023, he has been providing daily, research-driven insights through in-depth market analysis, on-chain data, and technical research.
Disclaimer: The information on this page may come from third parties and does not represent the views or opinions of Gate. The content displayed on this page is for reference only and does not constitute any financial, investment, or legal advice. Gate does not guarantee the accuracy or completeness of the information and shall not be liable for any losses arising from the use of this information. Virtual asset investments carry high risks and are subject to significant price volatility. You may lose all of your invested principal. Please fully understand the relevant risks and make prudent decisions based on your own financial situation and risk tolerance. For details, please refer to
Disclaimer.
Related Articles
423% Spot Flow Decline Hits Dogecoin (DOGE), Is Demand Quietly Returning? - U.Today
Dogecoin's recent price drop followed a five-day rise, indicating potential demand despite a negative net inflow. Future price predictions suggest resistance at $0.12, while T. Rowe Price's new ETF may boost interest. Traders are also focused on the upcoming Fed meeting.
UToday19m ago
GALA Exhausts Consolidation Phase, Prepares for 130% Spike As Bullish SMC Setup Signals Silent Sm...
The Gala (GALA) coin is attracting attention with its latest price movements, according to a revelation disclosed today by market analyst Crypto Patel. Despite the asset continuing its ongoing consolidation, underneath the surface, smart money is engaging in token accumulations
The GALA coin is th
BlockChainReporter1h ago
Dogecoin Flashes Rare Trend Reversal Signal, DOGE Price to $0.15? - U.Today
Dogecoin (DOGE) shows signs of a bullish reversal after a Heikin Ashi green candle emerged, suggesting potential for a rally to $0.15. Increased whale accumulation and trading volume bolster confidence in DOGE's upward trend.
UToday2h ago
Ethereum Price: Analyst Flashes Major ‘Buy’ Signal, Rally to $2,600 Soon?
March 16, 2026 8:15 pm EDT
TheCoinRepublic2h ago
BTC broke through $74,000 this week, with short-term holders' profits surging to $18.4 million per hour.
Gate News reported that on March 17, according to Glassnode data, Bitcoin price made a modest breakthrough above $74,000 this week, with short-term holder realized profit (STH-Realized Profit, 12-hour simple moving average) surging to $18.4 million per hour. This is consistent with the pattern observed in February: short-term holders continuously drain momentum from each bounce at the $70,000 level, absorbing upward momentum before any real breakout can form.
GateNews3h ago
