Pump.fun (PUMP), Story (IP), and Pudgy Penguins (PENGU) are experiencing a strong sell-off wave over the past 24 hours, indicating that market sentiment remains cautious. Both PUMP and IP are powerless against the important resistance level of the 50-day exponential moving average (EMA), triggering a correction phase on Wednesday’s trading session. Meanwhile, PENGU is retreating to test the 50-day EMA, reflecting ongoing profit-taking pressure. Overall, the technical outlook for these three cryptocurrencies remains negative, as the downward trend continues to dominate amid existing weakness.
Pump.fun faces the risk of sharp decline as bullish momentum wanes
As of Thursday when this article was written, Pump.fun is fluctuating around the 20-day EMA at $0.002248, after plunging 11% from the 50-day EMA at $0.002624 in the previous session. This move officially ends the eight consecutive bullish sessions for the token.
If PUMP loses the support zone at $0.002248, selling pressure could increase, pushing the price down to the psychological level of $0.002000. Further, the correction risk may extend to the S1 Pivot point at $0.001262.
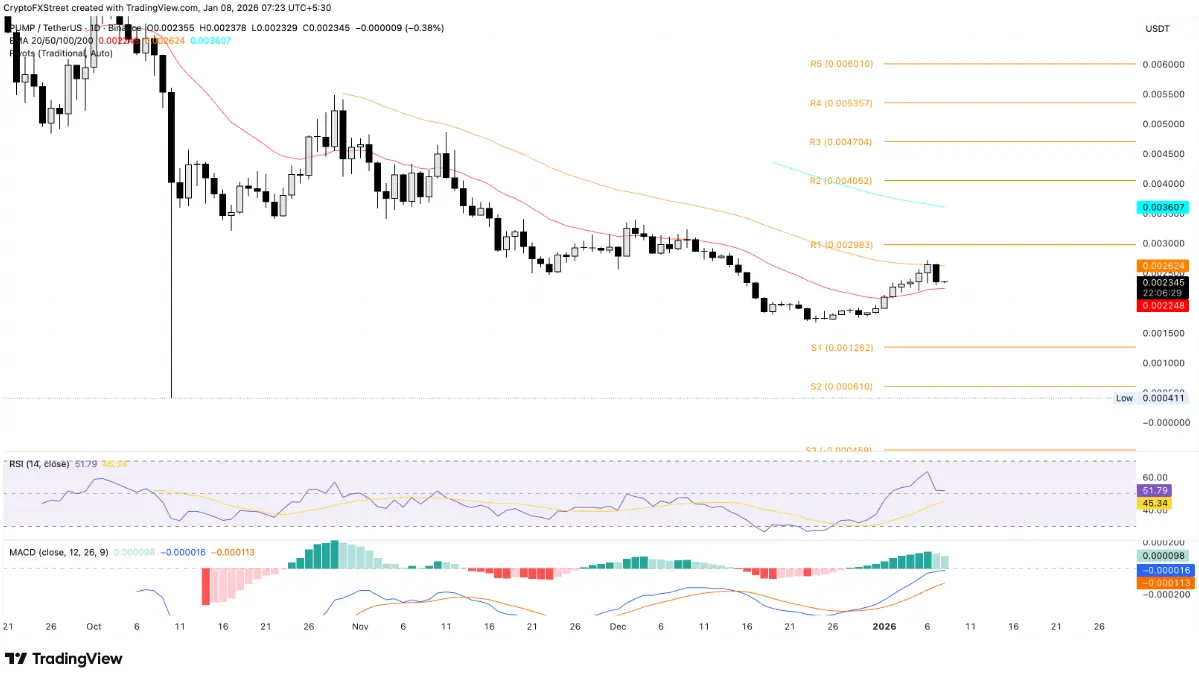 Daily PUMP/USDT chart | Source: TradingView The technical signals on the daily timeframe are warning of weakening demand. The RSI is currently at 51 and trending downward toward the neutral line, reflecting fading bullish momentum. At the same time, the MACD indicator continues to move sideways, with green histogram bars narrowing significantly, indicating a clear decline in bullish strength.
Conversely, if a recovery occurs and PUMP successfully breaks above the 50-day EMA at $0.002624, the price could regain upward momentum and target the resistance zone at the Pivot R1 point, around $0.002983.
Story faces a critical crossroads at the $2.00 mark
As of Thursday when this article was written, Story (IP) is hovering around the $2.00 level, marking its third consecutive decline. The price dropped 2% during the day, following a 4% decrease in the previous session, increasing correction pressure and putting this coin at risk of losing the 20-day EMA at around $1.91.
In a negative scenario, if IP breaks below the support level of $1.91, the decline could extend to the S1 Pivot point near $1.22.
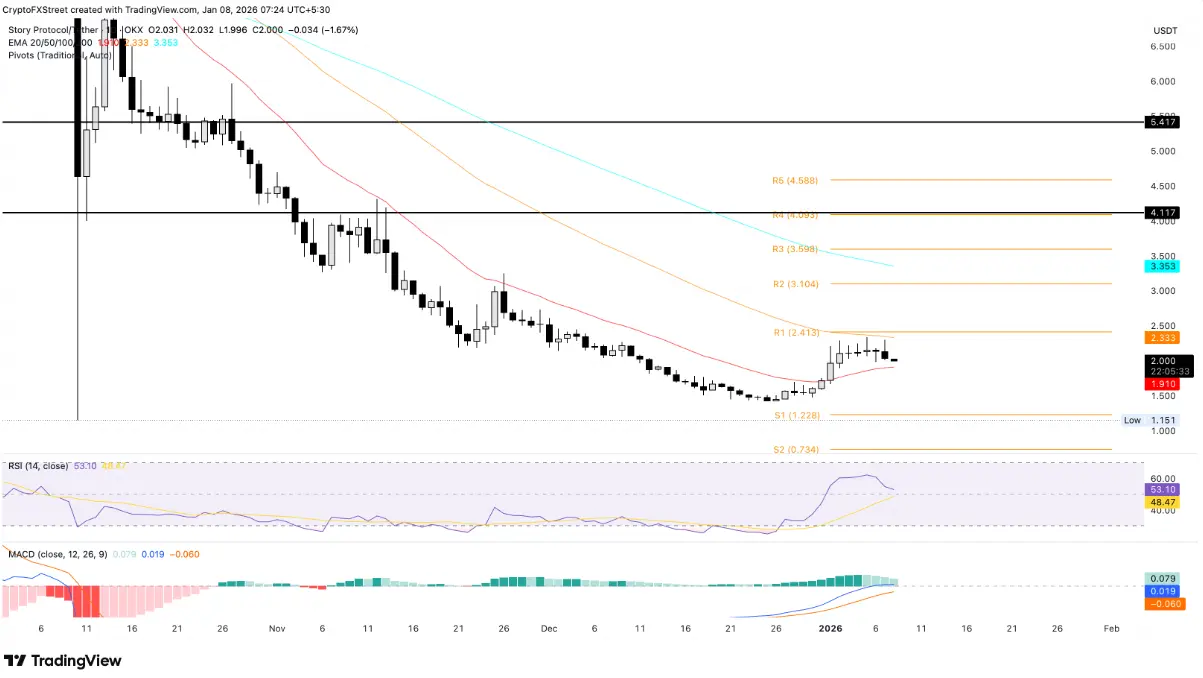 Daily IP/USDT chart | Source: TradingView Similar to PUMP, the technical indicators on the daily timeframe show that buying momentum for Story is weakening significantly. The RSI is currently at 53 and gradually approaching the neutral zone, while the MACD is nearing the signal line, increasing the risk of a bearish crossover — a sign that the correction trend may resume.
On the other hand, to restore bullish prospects, IP needs to decisively break above the 50-day EMA at $2.33. If successful, the price could target the Pivot R1 point around $2.41.
Pudgy Penguins at risk of losing the 50-day EMA
Pudgy Penguins remains resilient above the 50-day EMA at $0.01179, despite a sharp 9% correction on Wednesday. As of this writing, PENGU is fluctuating around $0.01200, close to the short-term resistance at the Pivot R1 level of $0.01193.
However, if the price loses this support zone, selling pressure could increase, pushing PENGU back to test the 20-day EMA at $0.01091 — near the important psychological level of $0.01000.
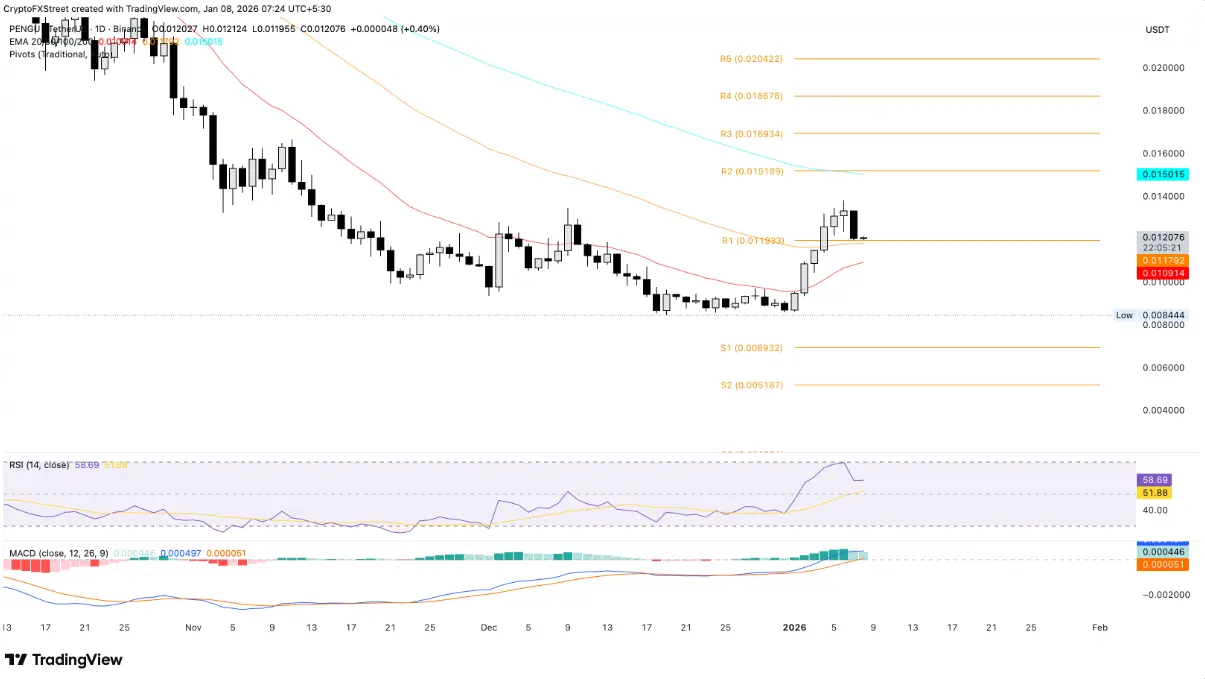 Daily PENGU/USDT chart | Source: TradingView Similar to PUMP and IP, the technical signals on the daily timeframe indicate that Pudgy Penguins’ buying momentum is weakening, implying short-term risks of correction.
In a more positive scenario, if demand returns, PENGU could initiate a recovery toward the next resistance zone at the Pivot R1 level of $0.01518.
Disclaimer: The information on this page may come from third parties and does not represent the views or opinions of Gate. The content displayed on this page is for reference only and does not constitute any financial, investment, or legal advice. Gate does not guarantee the accuracy or completeness of the information and shall not be liable for any losses arising from the use of this information. Virtual asset investments carry high risks and are subject to significant price volatility. You may lose all of your invested principal. Please fully understand the relevant risks and make prudent decisions based on your own financial situation and risk tolerance. For details, please refer to
Disclaimer.
Related Articles
ETH/BTC Price Ratio Rebounds to 0.0313 in Q1 2026 as Ethereum User Base Surges 82%
In Q1 2026, the Ethereum-to-Bitcoin price ratio reached a three-month high at 0.0313. Ethereum added 284,000 users and surpassed $180 billion in stablecoin supply. Bitcoin remained strong above $74,000, driven by significant ETF inflows.
GateNews4h ago
Why is Bitcoin up today? Trump says Iran is seeking a truce, and risk assets move higher across the board
On April 15, Bitcoin rebounded about 6% after Trump said Iran is seeking to reach an agreement, breaking above $75,000. Expectations for the resumption of U.S.-Iran negotiations warmed up, lifting Asian stock markets. Technically, roughly $6 billion worth of short positions were forced to close, accelerating the rebound. Analysts said that if the U.S.-Iran situation continues to ease, Bitcoin could break through $80,000, and they predicted it may reach $150,000 by year-end.
MarketWhisper8h ago
Bitmine is promoted to the NYSE main board! Tom Lee: US stocks may be at a bottom, and selling pressure on Ether could ease
Bitmine officially transferred from the NYSE American market to the main board, marking a significant milestone for the company. Despite a sharp drop in its share price, it still increased the share repurchase program to $4 billion. The company holds a large amount of Ether, and expects that a rebound in the crypto market will help improve its assets and share price performance.
CryptoCity8h ago
ETH 15-minute up 0.66%: On-chain large transfers in sync drove a net inflow of funds, boosting spot buying pressure
2026-04-15 00:00 to 00:15 (UTC), ETH shows a local anomaly. The 15-minute return rate is +0.66%. The trading price range is 2321.93–2343.2 USDT, with a range of 0.92%. During this period, market attention increased, volatility slightly intensified, buy pressure in the order book shifted upward in the short term, and quickly pushed spot prices up into a key resistance area.
The main drivers of this anomaly are large on-chain transfers and inflows of capital in combination. At the beginning of the window, multiple large ETH transfers appeared, including 8,676 ETH and 6,551 ETH, respectively, transferring from a large source to the
GateNews9h ago
BTC 15-minute drop of 0.54%: Liquidity worsens and whales actively reduce positions, putting short-term pressure on the market
From 22:15 to 22:30 (UTC) on 2026-04-14, BTC saw a short-term pullback of 0.54% within the high-range band of 73911.6 - 74314.4 USDT, with a return of -0.54%. During this period, market swings were evident, volatility intensified, attention from the market quickly increased, and downward pressure on the order book was prominent.
The main drivers behind this unusual move were the continued deterioration of market liquidity and a clear lack of order book depth, which made the BTC price extremely sensitive to large sell orders. At the same time, during the key time window, whale wallets carried out large transfers and also engaged in active de-risking,
GateNews11h ago
ETH 15-minute drop of 0.61%: Sell orders concentrate and release while bearish sentiment intensifies, increasing downward pressure
2026-04-14 22:15 to 2026-04-14 22:30 (UTC) during this period, on the 15-minute K-line, ETH recorded a -0.61% return, with a price range of 2313.68 to 2328.54 USDT and a fluctuation of 0.64%. During this period, market attention increased, trading volume expanded noticeably, and heightened short-term volatility sparked strong interest in the subsequent trend.
The main drivers behind this unusual move are the concentrated release of sell orders and continued net outflows of on-chain funds. Specifically, the sell volume share rose to 52%, higher than the buy side at 48%, indicating heavy selling pressure
GateNews11h ago
