**Date: **Wed, Jan 07, 2026 | 06:20 AM GMT
The broader cryptocurrency market continues to show strong New Year momentum, with Bitcoin (BTC) up around 4% and Ethereum (ETH) gaining over 9% on a weekly basis. This improving sentiment is gradually spilling over into major altcoins — including the DePIN-focused token Akash Network (AKT).
AKT has already posted an impressive 20% weekly gain. While this short-term strength has caught traders’ attention, the more important development is unfolding on the higher-timeframe chart. Recent price action suggests a meaningful shift in market structure, hinting that AKT may be transitioning out of a prolonged corrective phase and into the early stages of a bullish continuation.

Source: Coinmarketcap
Falling Wedge and Rounding Bottom in Play
On the daily chart, AKT has been trading within a broader falling wedge — a structure that often precedes bullish reversals as selling pressure gradually weakens. Within this larger wedge, price action is also shaping a developing rounding bottom pattern, reflecting steady accumulation and seller exhaustion.
The formation began after AKT faced strong rejection near the $0.5441 resistance zone in late November. That rejection triggered a sharp sell-off, pushing price lower toward the $0.3465 region. However, bears failed to extend losses beyond this area. Instead, demand stepped in, downside momentum slowed, and price began to stabilize.
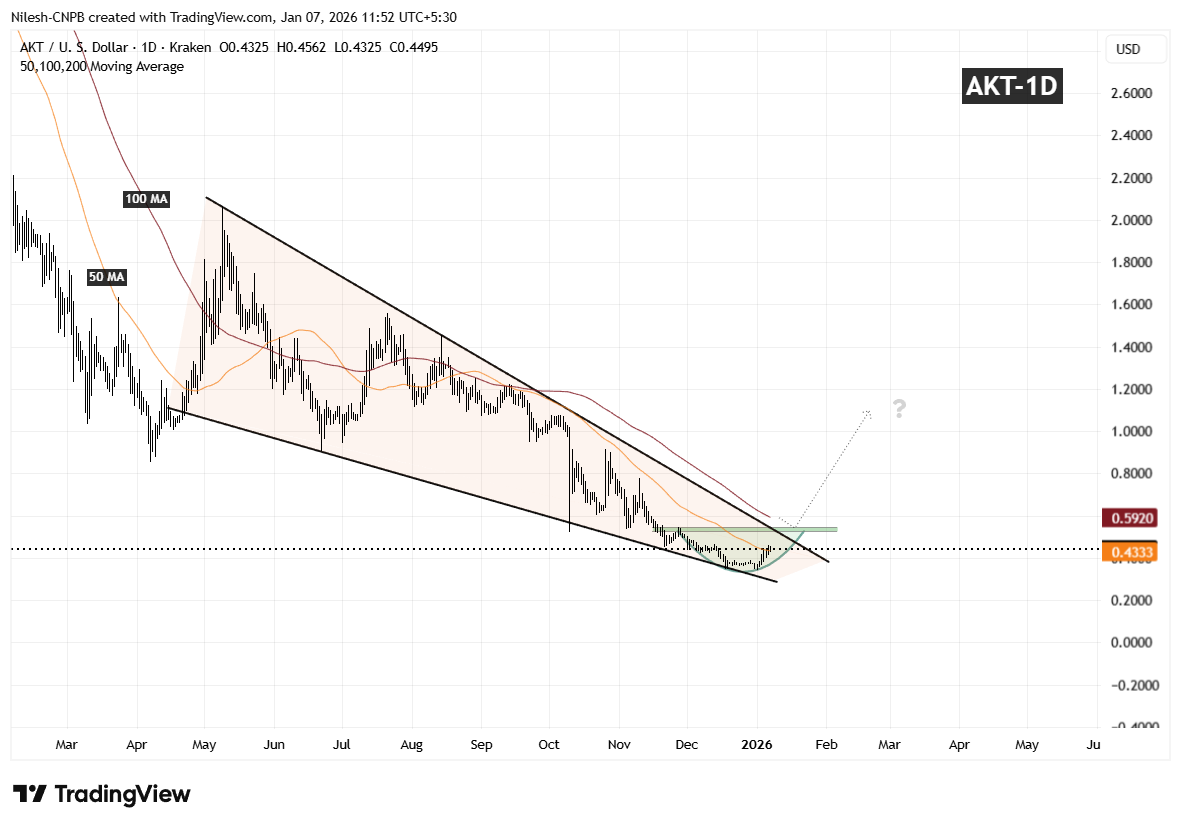
Akash Network (AKT) Daily Chart/Coinsprobe (Source: Tradingview)
Over the following weeks, volatility compressed and AKT started to curl higher in a smooth, rounded fashion — closely matching the textbook behavior of a rounding bottom. Importantly, the recent rebound has pushed price back above the 50-day moving average around $0.4333, a level that had previously acted as resistance and is now beginning to flip into support.
What’s Next for AKT?
If AKT can continue to hold above the 50-day moving average, this area may act as a solid base for further upside attempts. From here, attention shifts toward the descending resistance trendline of the falling wedge, which aligns closely with the $0.5441 resistance zone.
A clean and decisive breakout above this confluence area, followed by sustained acceptance, would confirm a broader bullish expansion phase and mark a clear trend reversal from the prior downtrend. Such a move would likely attract renewed momentum participation as the market recognizes the structural shift.
Until that breakout occurs, the pattern remains in development. Short-term consolidation or shallow pullbacks are still possible as price digests recent gains. However, as long as AKT continues to print higher lows above the established base, the broader technical structure remains constructive.
Overall, the chart suggests AKT is approaching a critical inflection point — one that could determine whether this recovery evolves into a sustained bullish trend as 2026 progresses.
Disclaimer: The views and analysis presented in this article are for informational purposes only and reflect the author’s perspective, not financial advice. Technical patterns and indicators discussed are subject to market volatility and may or may not yield the anticipated results. Investors are advised to exercise caution, conduct independent research, and make decisions aligned with their individual risk tolerance.
About Author: Nilesh Hembade is the Founder and Lead Author of Coinsprobe, with over 5 years of experience in the cryptocurrency and blockchain industry. Since launching Coinsprobe in 2023, he has been providing daily, research-driven insights through in-depth market analysis, on-chain data, and technical research.
Disclaimer: The information on this page may come from third parties and does not represent the views or opinions of Gate. The content displayed on this page is for reference only and does not constitute any financial, investment, or legal advice. Gate does not guarantee the accuracy or completeness of the information and shall not be liable for any losses arising from the use of this information. Virtual asset investments carry high risks and are subject to significant price volatility. You may lose all of your invested principal. Please fully understand the relevant risks and make prudent decisions based on your own financial situation and risk tolerance. For details, please refer to
Disclaimer.
Related Articles
BlackRock sees AI driving crypto’s next bull phase as altcoin interest fades
Robbie Mitchnick from BlackRock highlighted a shift in crypto investment focus, emphasizing AI's growing importance over new tokens. Investors are concentrating on established assets like Bitcoin and Ethereum, with AI seen as a key driver influencing crypto's future and potential as infrastructure.
CoinDesk25m ago
Shiba Inu Burn Rate Jumps 370% as SHIB Breaks Key Level
Key Insights:
The Shiba Inu burn rate surged over 370% in 24 hours, removing more than 4.2 million tokens and reducing the overall circulating supply significantly.
SHIB price climbed above a key resistance level while forming higher lows, indicating steady accumulation despite declining
CryptoNewsLand48m ago
Solana Reclaims $90 as Golden Cross Signals Renewed Momentum
Solana has surpassed the $90 resistance, aided by a golden cross indicating positive momentum, despite low trading volume. Strong on-chain growth supports price stability, and sustained support above $89.50 could push Solana towards $96, though higher volume is crucial for confirming a breakout.
CryptoNewsLand1h ago
Hyperliquid Gains Traction as ETF Push Meets Strong Momentum
Key Insights:
Grayscale ETF filing has increased institutional visibility for HYPEUSD, strengthening demand expectations as traditional investors seek simplified exposure to the Hyperliquid ecosystem.
Technical indicators show
CryptoNewsLand1h ago
Cardano Faces $9.9M Liquidation Risk as ADA Hovers Near Key Support
Cardano is currently trading near $0.264, facing potential liquidation risks if it drops to $0.253. While on-chain data indicate reduced realized losses, the market remains in a distribution phase, hindering recovery. Resistance challenges persist between $0.2856 and $0.300, necessitating a stronger rally for upside movement.
CryptoFrontNews1h ago
Bittensor Jumps 20% After Jensen Huang Backs Distributed AI
Key Insights:
Bittensor surged over 20% after NVIDIA CEO Jensen Huang highlighted its distributed AI training, drawing strong attention from both crypto and technology markets.
The TAO price broke above the Bull Market Support Band for the first time since November, signaling a potential
CryptoNewsLand2h ago
