
When you zoom out and look at what Monero has been doing lately, the picture becomes pretty clear.
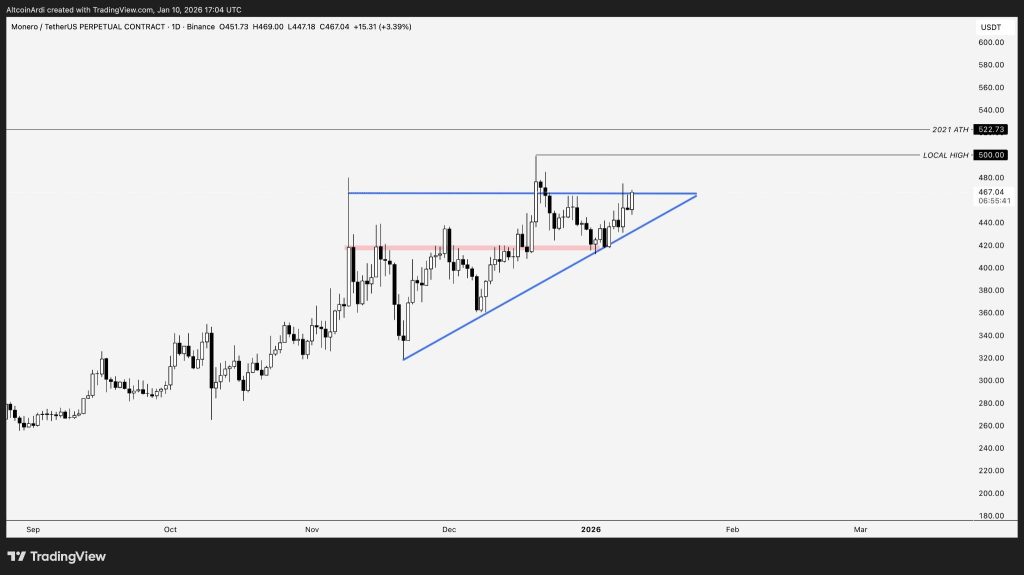
The XMR price has been trending higher overall, but instead of ripping upward, it’s been compressing into a tighter range. That compression has formed a clean ascending triangle, which usually shows buyers stepping in more confidently while sellers keep defending the same level.
Trader Ardi points out that Monero is now printing a higher low while continuing to push into the $460 area. That level has rejected the price several times already, so it’s not surprising the market is slowing down here.
What matters is that each pullback is getting smaller. Buyers are clearly showing up earlier than before, and that usually means pressure is building.
- Why the $460 Level Is So Important for XMR
- What the XMR Chart Is Telling Us Right Now
- What Comes Next for XMR?
Why the $460 Level Is So Important for XMR
The $460 zone isn’t just another number on the chart. It lines up with previous highs and has acted as a wall every time price has tested it. Right now, the XMR price is pressing right up against that resistance while still respecting the rising trendline underneath.
That combination is key. As long as the price keeps holding those higher lows, the setup stays intact. What traders want to see next is acceptance above $460, not just a quick wick or short-lived push.
A real breakout means holding above that level and flipping it into support. Until that happens, Monero remains in a coiling phase rather than a confirmed breakout.
What the XMR Chart Is Telling Us Right Now
From a structure point of view, this is exactly how strong setups tend to behave before a bigger move.
Instead of selling off hard after rejection, the XMR price keeps coming back to resistance with less downside each time. That usually means sellers are slowly getting absorbed.
Source: X/@ArdiNSC
The higher low on the chart supports that idea. It shows buyers are defending price more aggressively, even though resistance is still holding.
This kind of price action can feel slow and frustrating, which Ardi also mentions, but it often does a good job of shaking out impatient traders before the move actually happens.
Bittensor (TAO) Price Tests a Key Level That Could Change the Trend_**
What Comes Next for XMR?
However, if the XMR price can manage to break past the level of $460 and sustain it, the ascending pattern would be resolved. The next level in such a case would be the area of $500, with a further move towards the 2021 high of $522.
If the price fails to hold the rising trendline, the breakout idea gets delayed. A dip toward the low $420s or high $400s wouldn’t break the structure on its own, but it would stretch out the consolidation and test buyer confidence again.
For now, the setup is still very much alive. The XMR price isn’t breaking down, downside is being defended, and pressure continues to build. This is one of those charts where patience usually matters more than speed, and that’s often when Monero tends to surprise people.
Disclaimer: The information on this page may come from third parties and does not represent the views or opinions of Gate. The content displayed on this page is for reference only and does not constitute any financial, investment, or legal advice. Gate does not guarantee the accuracy or completeness of the information and shall not be liable for any losses arising from the use of this information. Virtual asset investments carry high risks and are subject to significant price volatility. You may lose all of your invested principal. Please fully understand the relevant risks and make prudent decisions based on your own financial situation and risk tolerance. For details, please refer to
Disclaimer.
Related Articles
CryptoQuant: Bitcoin and Gold Correlation Falls to Nearly 4-Year Low, Showing Clear Divergence in Trends
The correlation between Bitcoin and gold has fallen to its lowest level since November 2022, showing a clear divergence in their trajectories. Despite Bitcoin's recent rebound to $70,000, bearish pressure is intensifying, and investors need to monitor key support levels and gold price movements to gauge market direction.
GateNews13m ago
XRP breaks through $1.5 neckline, key EMA resistance determines short-term trend, potential to test $2
XRP recently broke through the $1.5 resistance level, creating a new closing high. Analysts point out that the short-term support level is at $1.5, which needs to hold to continue the uptrend. If this level breaks, the $1.42 support can be referenced as an alternative. A breakout above three EMAs is needed to confirm a bullish reversal. Market participants should pay attention to price movement and changes in technical indicators.
GateNews27m ago
Hyperliquid Price Jumps 22% as Commodity Trading Hits Record
Key Insights:
Hyperliquid surged over 20% weekly, driven by record commodity futures trading volumes, especially oil and silver contracts, gaining strong traction among traders.
Whale activity surpassed $3.6 billion in leveraged positions, boosting liquidity and reinforcing upward momentum a
CryptoFrontNews30m ago
Bitcoin Falls Below $70,000: PPI Exceeds Expectations + Powell's Hawkish Stance, Rate Cut Expectations Dampened
On March 19, Bitcoin pulled back to a key support zone due to unexpected U.S. inflation data and hawkish signals from Federal Reserve Chair Powell, declining over 4.6% and currently trading near $70,800. Market expectations for rate cuts have cooled, with the total crypto market cap declining to approximately $2.51 trillion and sentiment remaining cautious. If Bitcoin breaks below $70,000, it could potentially decline further to $65,000. Market momentum is highly dependent on macroeconomic factors.
GateNews36m ago
Bitcoin Fails to Break Higher: Why the $70,000 Level Remains Elusive? Key Indicators Reveal Upside Concerns
Bitcoin recently briefly broke through $74,000 but pulled back to around $70,800 due to selling pressure from short-term holders. While the price shows an upward trend, it faces structural resistance, and the current movement appears more like a bear market rally rather than the start of a bull market. Without effectively resisting selling pressure, it could break below the $70,000 support level. The market is still waiting for clearer signals.
GateNews44m ago
