
Key Highlights
-
Bitcoin spot ETFs recorded $100M net inflow on Jan 15
-
Historical ETF inflows now exceed $58B
-
BTC confirmed an ascending triangle breakout
-
Price currently retesting breakout support near $95K
-
Measured move projects upside toward $108K
Bitcoin (BTC) is showing a mild pullback on January 16, 2026, trading around $95,500 after recently tagging a local high near $97,909 on January 14. The rally followed a mix of softer-than-expected U.S. inflation data and strong buying pressure from spot Bitcoin ETFs, both of which helped lift overall market sentiment.
While short-term price action reflects some cooling after the recent surge, the broader technical structure remains constructive, with the chart still favoring a continuation to the upside.
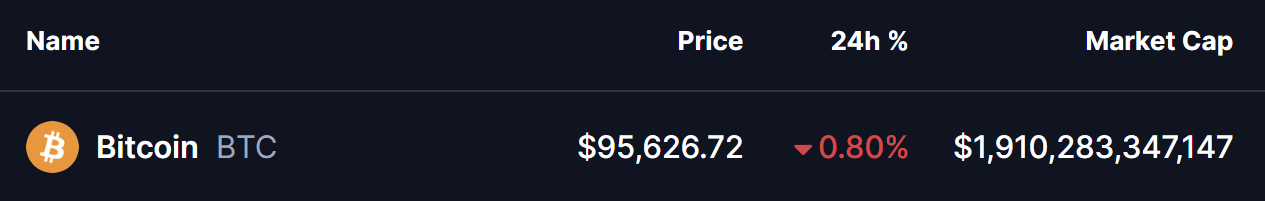
Source: Coinmarketcap
Bitcoin’s Positive ETF Inflows Signal Strong Institutional Demand
Institutional interest in Bitcoin remains robust. According to SoSoValue data, Bitcoin spot ETFs recorded a net inflow of $100 million on January 15, extending a streak of strong capital inflows.
Earlier this month, ETFs saw even larger buying activity, with $843 million, $753 million, and $116 million in inflows recorded up to January 12. This consistent demand highlights growing confidence among ETF investors, even as BTC consolidates near recent highs.
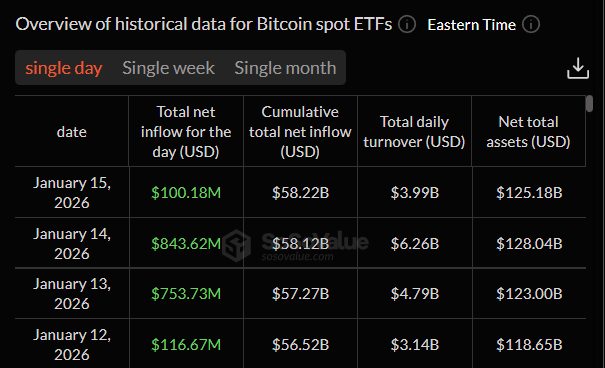
Source: SoSoValue
At press time, the total net asset value of Bitcoin spot ETFs stands at $125.18 billion, representing 6.58% of Bitcoin’s total market capitalization. Meanwhile, historical cumulative net inflows have reached $58.22 billion, reinforcing the idea that institutional participation continues to play a key role in supporting Bitcoin’s price.
Bitcoin Retesting a Key Breakout Zone
From a technical perspective, Bitcoin’s chart structure has improved meaningfully. On the daily timeframe, BTC recently broke out of an ascending triangle, a classic bullish continuation pattern characterized by higher lows pressing against a horizontal resistance level.
The breakout occurred around $94,700, followed by a strong impulse move toward the $97,900 region. This surge confirmed buyer dominance and shifted market structure firmly back in favor of bulls.
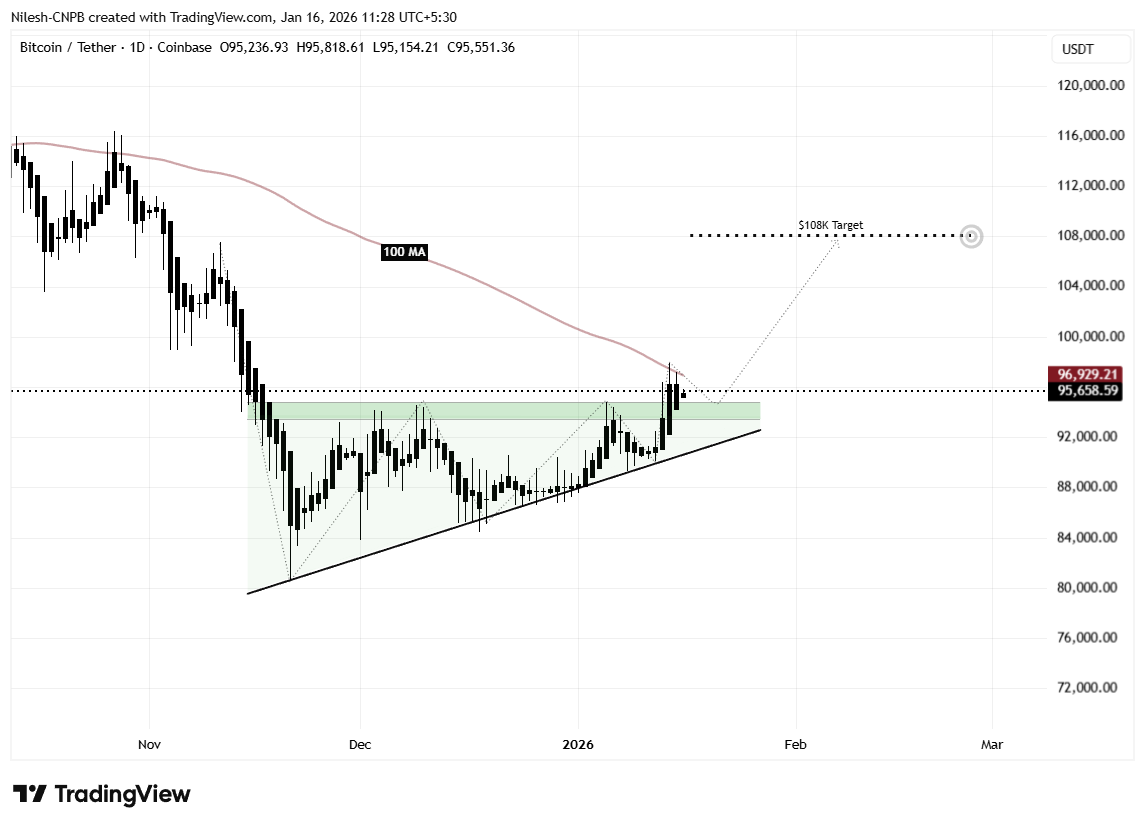
Bitcoin (BTC) Daily Chart/Coinsprobe (Source: Tradingview)
Currently, Bitcoin is trading slightly below the 100-day moving average, appearing to drift lower as part of a breakout retest. Such retests are generally considered healthy in trending markets and often act as confirmation that previous resistance has flipped into support — provided price holds above the former consolidation range.
What the Chart Suggests Next for BTC?
The ongoing pullback remains constructive as long as buyers continue to defend the mid-$95,000 support zone. Holding above this area would suggest that market participants are using the dip to accumulate rather than exit positions.
If bullish momentum resumes from this level, the first key objective would be a reclaim of the 100-day moving average near $96,929, followed by a retest of the $97,900 local high. A decisive push above that level would further strengthen bullish control and validate the breakout–retest structure.
Based on the measured move projection of the ascending triangle breakout, a successful continuation could send Bitcoin toward the $108,000 region. This target aligns with the extension shown on the chart and represents roughly 13% upside from the breakout area.
Bottom Line
The broader setup continues to lean bullish. Positive ETF net inflows, improving macro sentiment, a confirmed bullish chart pattern, and rising retail caution together create an environment that favors continuation rather than a deeper reversal.
While short-term volatility is expected after a strong rally, Bitcoin’s structure suggests that any controlled pullbacks may serve as a foundation for the next leg higher — potentially putting the $100K milestone back into focus in the weeks ahead.
Frequently Asked Questions (FAQ)
What is driving Bitcoin’s recent price strength?
Bitcoin’s recent strength is being supported by strong spot ETF inflows, improving macro sentiment after softer U.S. inflation data, and a confirmed bullish breakout on the daily chart.
How much money is flowing into Bitcoin spot ETFs?
Bitcoin spot ETFs recorded around $100 million in net inflows on January 15, following massive inflows of $843M, $753M, and $116M earlier in January, highlighting sustained institutional demand.
What technical pattern has Bitcoin formed?
Bitcoin has broken out of an ascending triangle pattern, a bullish continuation structure characterized by higher lows pressing against a resistance level. The current pullback appears to be a healthy retest of that breakout.
Why is the $95K level important for BTC?
The mid-$95K zone represents the breakout support area. As long as Bitcoin holds above this level, the bullish structure remains intact and favors continuation rather than reversal.
What is Bitcoin’s upside target based on the chart?
Based on the measured move from the ascending triangle breakout, Bitcoin could potentially rally toward the $108K region, representing roughly 13% upside from the breakout zone.
Disclaimer: The views and analysis presented in this article are for informational purposes only and reflect the author’s perspective, not financial advice. Technical patterns and indicators discussed are subject to market volatility and may or may not yield the anticipated results. Investors are advised to exercise caution, conduct independent research, and make decisions aligned with their individual risk tolerance.
About Author: Nilesh Hembade is the Founder and Lead Author of Coinsprobe, with over 5 years of experience in the cryptocurrency and blockchain industry. Since launching Coinsprobe in 2023, he has been providing daily, research-driven insights through in-depth market analysis, on-chain data, and technical research.
Disclaimer: The information on this page may come from third parties and does not represent the views or opinions of Gate. The content displayed on this page is for reference only and does not constitute any financial, investment, or legal advice. Gate does not guarantee the accuracy or completeness of the information and shall not be liable for any losses arising from the use of this information. Virtual asset investments carry high risks and are subject to significant price volatility. You may lose all of your invested principal. Please fully understand the relevant risks and make prudent decisions based on your own financial situation and risk tolerance. For details, please refer to
Disclaimer.
Related Articles
Why is Bitcoin up today? Trump says Iran is seeking a truce, and risk assets move higher across the board
On April 15, Bitcoin rebounded about 6% after Trump said Iran is seeking to reach an agreement, breaking above $75,000. Expectations for the resumption of U.S.-Iran negotiations warmed up, lifting Asian stock markets. Technically, roughly $6 billion worth of short positions were forced to close, accelerating the rebound. Analysts said that if the U.S.-Iran situation continues to ease, Bitcoin could break through $80,000, and they predicted it may reach $150,000 by year-end.
MarketWhisper42m ago
Bitmine is promoted to the NYSE main board! Tom Lee: US stocks may be at a bottom, and selling pressure on Ether could ease
Bitmine officially transferred from the NYSE American market to the main board, marking a significant milestone for the company. Despite a sharp drop in its share price, it still increased the share repurchase program to $4 billion. The company holds a large amount of Ether, and expects that a rebound in the crypto market will help improve its assets and share price performance.
CryptoCity57m ago
ETH 15-minute up 0.66%: On-chain large transfers in sync drove a net inflow of funds, boosting spot buying pressure
2026-04-15 00:00 to 00:15 (UTC), ETH shows a local anomaly. The 15-minute return rate is +0.66%. The trading price range is 2321.93–2343.2 USDT, with a range of 0.92%. During this period, market attention increased, volatility slightly intensified, buy pressure in the order book shifted upward in the short term, and quickly pushed spot prices up into a key resistance area.
The main drivers of this anomaly are large on-chain transfers and inflows of capital in combination. At the beginning of the window, multiple large ETH transfers appeared, including 8,676 ETH and 6,551 ETH, respectively, transferring from a large source to the
GateNews1h ago
BTC 15-minute drop of 0.54%: Liquidity worsens and whales actively reduce positions, putting short-term pressure on the market
From 22:15 to 22:30 (UTC) on 2026-04-14, BTC saw a short-term pullback of 0.54% within the high-range band of 73911.6 - 74314.4 USDT, with a return of -0.54%. During this period, market swings were evident, volatility intensified, attention from the market quickly increased, and downward pressure on the order book was prominent.
The main drivers behind this unusual move were the continued deterioration of market liquidity and a clear lack of order book depth, which made the BTC price extremely sensitive to large sell orders. At the same time, during the key time window, whale wallets carried out large transfers and also engaged in active de-risking,
GateNews3h ago
ETH 15-minute drop of 0.61%: Sell orders concentrate and release while bearish sentiment intensifies, increasing downward pressure
2026-04-14 22:15 to 2026-04-14 22:30 (UTC) during this period, on the 15-minute K-line, ETH recorded a -0.61% return, with a price range of 2313.68 to 2328.54 USDT and a fluctuation of 0.64%. During this period, market attention increased, trading volume expanded noticeably, and heightened short-term volatility sparked strong interest in the subsequent trend.
The main drivers behind this unusual move are the concentrated release of sell orders and continued net outflows of on-chain funds. Specifically, the sell volume share rose to 52%, higher than the buy side at 48%, indicating heavy selling pressure
GateNews3h ago
TAO Falls 6.9% in 24 Hours as Covenant Exit and Market Rotation Weigh on Price
Bittensor's TAO token fell 6.9% to $238.91 amid a week-long decline linked to Covenant AI's exit due to centralized control concerns. Competing AI tokens had smaller declines. Despite the downturn, TAO remains the top AI token by market cap, with Grayscale increasing its allocation.
GateNews3h ago
