
Key Takeaways
-
Pepe (PEPE) is up nearly 47% year-to-date, benefiting from improving sentiment across the broader crypto and memecoin market.
-
Bitcoin’s 9% YTD rise and Ethereum reclaiming $3,300 have helped fuel renewed risk appetite among traders.
-
PEPE’s daily chart is forming a bullish fractal that closely mirrors the October–November 2024 setup, which previously led to a 160% rally.
As 2026 kicks off, the broader memecoin market is showing renewed upside momentum, and Pepe (PEPE) is once again finding itself in the spotlight. With Bitcoin already up around 9% year-to-date and Ethereum reclaiming the $3,300 level with an 11% YTD rise, overall crypto sentiment has clearly improved. Riding this wave, PEPE has surged nearly 47% so far this year.
While the short-term price action looks encouraging on its own, the bigger story appears to be unfolding on the charts. A familiar bullish fractal structure is starting to take shape, one that previously led to an explosive upside move.
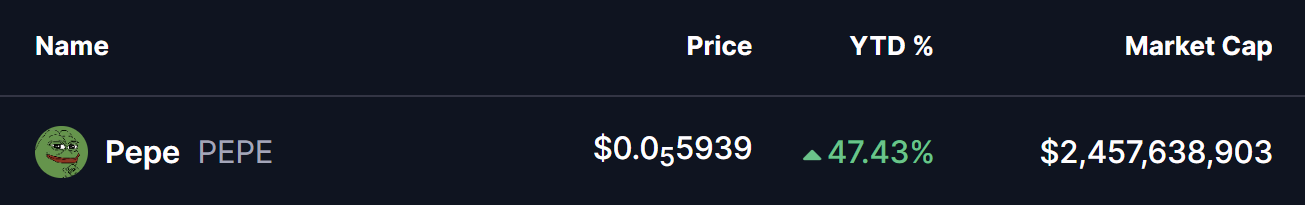
Source: Coinmarketcap
Fractal Setup Hints at a Bullish Breakout
On the daily timeframe, PEPE’s current price behavior closely resembles a structure seen during the October–November 2024 period, as highlighted in the chart comparison. Back then, PEPE bounced from its downtrend lows and began forming a falling wedge pattern. After a period of consolidation, price eventually broke out and reclaimed the 200-day moving average.
That reclaim proved to be the key trigger. Once PEPE moved back above the 200-day MA, bullish momentum accelerated sharply, resulting in a powerful rally of roughly 160% in a relatively short span.
Fast forward to the present, and a similar setup appears to be developing again. PEPE recently rebounded from its range lows and pushed to a local high near $0.0000072. Since then, price has entered a consolidation phase that is shaping into another falling wedge, closely mirroring the pre-breakout behavior seen late last year.
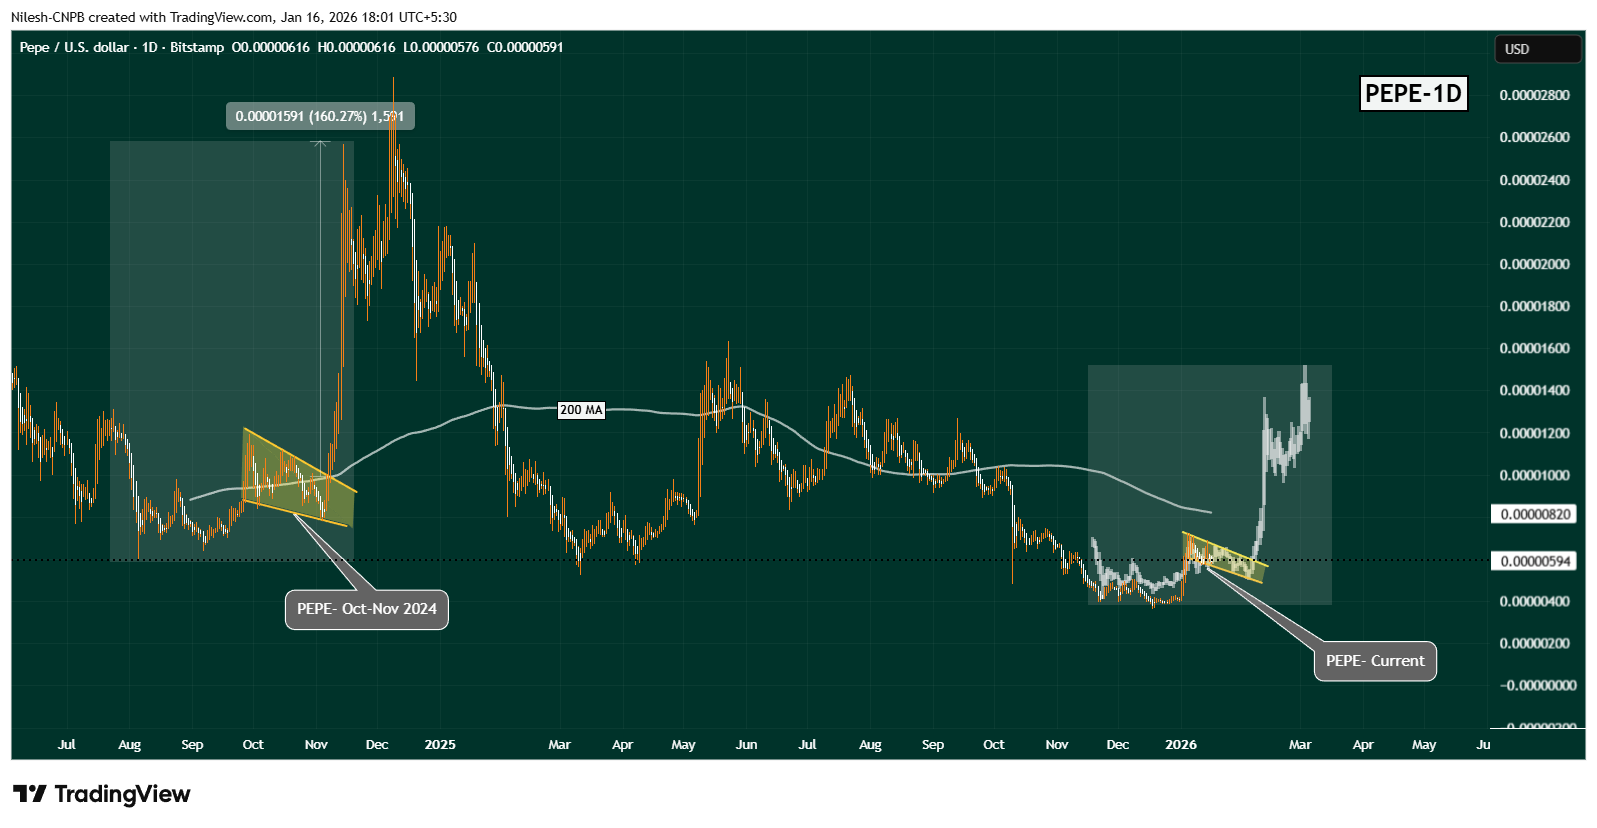
PEPE Fractal Chart/Coinsprobe (Source: Tradingview)
What strengthens this comparison is not just the pattern itself, but the overall structure. The bounce from the bottom, the measured consolidation, and the positioning just below the 200-day moving average all align well with the previous bullish fractal. This alignment suggests that PEPE may be quietly building energy for its next move higher.
What’s Next for PEPE?
If this bullish fractal continues to play out, PEPE could see a bit more sideways to slightly downward consolidation within the falling wedge. A temporary dip toward the $0.0000052 area would still fit the broader setup before a more decisive move emerges.
A confirmed breakout followed by a reclaim of the 200-day moving average around $0.0000082 would be a major technical shift. Should that happen, the fractal projection points toward a potential move into the $0.000015 zone, implying a possible upside of around 150% from the breakout base, similar to the November rally.
Of course, fractal patterns are not guarantees. Broader market conditions, liquidity flows, and overall sentiment will continue to play a role. While the similarities on the chart are compelling, traders should watch for strong volume expansion and sustained follow-through above resistance before expecting a full repeat of the previous move.
Bottom Line
PEPE is showing early signs of a familiar bullish setup that has delivered strong gains in the past. With market sentiment improving and a well-defined fractal forming on the daily chart, the coming weeks could be crucial. If history even partially rhymes, PEPE may be setting the stage for another meaningful upside run, making it a memecoin worth watching closely as 2026 unfolds.
Disclaimer: The views and analysis presented in this article are for informational purposes only and reflect the author’s perspective, not financial advice. Technical patterns and indicators discussed are subject to market volatility and may or may not yield the anticipated results. Investors are advised to exercise caution, conduct independent research, and make decisions aligned with their individual risk tolerance.
About Author: Nilesh Hembade is the Founder and Lead Author of Coinsprobe, with over 5 years of experience in the cryptocurrency and blockchain industry. Since launching Coinsprobe in 2023, he has been providing daily, research-driven insights through in-depth market analysis, on-chain data, and technical research.
Disclaimer: The information on this page may come from third parties and does not represent the views or opinions of Gate. The content displayed on this page is for reference only and does not constitute any financial, investment, or legal advice. Gate does not guarantee the accuracy or completeness of the information and shall not be liable for any losses arising from the use of this information. Virtual asset investments carry high risks and are subject to significant price volatility. You may lose all of your invested principal. Please fully understand the relevant risks and make prudent decisions based on your own financial situation and risk tolerance. For details, please refer to
Disclaimer.
Related Articles
The Definitive Stablecoin Landscape Series: North America
Stablecoins are undergoing an evolution into a foundational financial infrastructure. North America leads in development, focusing on regulated, compliant options. The market shows a shift with RLUSD gaining traction due to integration with Ripple, emphasizing real demand over exchange liquidity.
CoinDesk55m ago
Bittensor Price Jumps 120% as AI Momentum Fuels TAO Demand
Bittensor's TAO token surged over 120% in March due to increased network activity and NVIDIA CEO's endorsement. The decentralized AI network's subnet expansion bolstered demand, with support at $300 and resistance near $340 indicating potential future price movements.
CryptoNewsLand56m ago
PEPE Price Holds Bearish Structure as Rebound Signal Emerges
Key Insights
PEPE remains in a clear downtrend, with persistent lower highs and continued selling pressure keeping the price near key support levels around $0.00000330.
The TD Sequential indicator signals a possible rebound after an extended decline, suggesting a move toward 0.0000050 if
CryptoNewsLand1h ago
What next as XRP rises to $1.33 but fails to break out
XRP is currently trading around $1.33, showing slight upward movement but lacking a breakout. Volume is up, indicating potential positioning rather than strong conviction. Key price levels to watch are $1.30 as support and $1.34-$1.35 as resistance, with XRP remaining range-bound in the meantime.
CoinDesk1h ago
Solana Holds Key Support as Bitcoin Rally Lifts Crypto Market
Solana's price remained above $80 amid rising Bitcoin values, contributing to a broader crypto market recovery with a capitalization of $2.35 trillion. Institutional demand and easing geopolitical tensions supported this growth, while Solana led in decentralized finance activity, recording significant DEX and stablecoin volumes in March.
CryptoNewsLand1h ago
Hyperliquid Sees Sharp Volume Drop as Netflows Turn Deeply Negative
Hyperliquid’s derivatives volume dropped sharply, with some platforms reporting declines above 60%, signaling reduced speculative activity and weakening trader engagement across markets.
Netflows turned deeply negative near -285%, reflecting sustained capital withdrawal as both spot and
CryptoNewsLand2h ago
