
Key Takeaways
-
Fartcoin (FARTCOIN) is trading near $0.33 amid a broader crypto market sell-off driven by macro uncertainty.
-
The 4H chart shows a Bullish Bat harmonic pattern, often associated with short-term trend reversals.
-
Price has reacted positively from the D-point support near $0.288, hinting at seller exhaustion.
-
A breakout above the 50-period moving average around $0.374 could confirm bullish momentum.
-
Harmonic targets point toward $0.404 and $0.476 if the pattern plays out successfully.
-
A breakdown below $0.288 would invalidate the bullish setup.
As of January 19, 2026, Fartcoin (FARTCOIN) is trading slightly lower around $0.33, moving in line with the broader crypto market pullback. The sell-off was triggered by escalating US–EU trade tensions, which sparked nearly $875 million in long liquidations and pushed major assets like Bitcoin (BTC) and Ethereum (ETH) down more than 2% over the past 24 hours.
While FARTCOIN is down over 3% at the time of writing, the price action beneath the surface tells a more interesting story. The latest chart structure is now flashing a potential bullish harmonic setup, suggesting the current dip could be more of a setup than a breakdown.
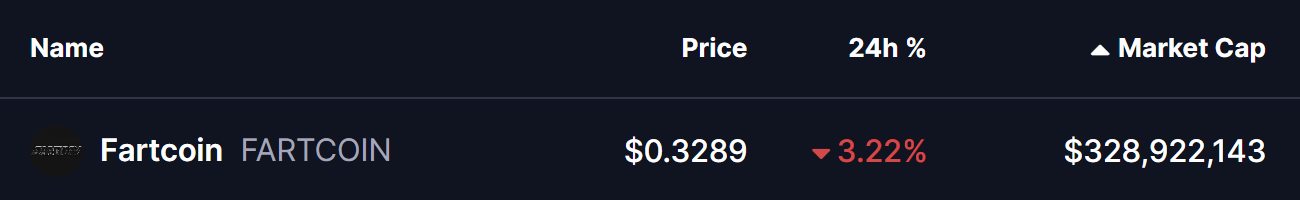
Source: Coinmarketcap
Harmonic Pattern Signals a Possible Reversal
On the 4-hour timeframe, Fartcoin is forming a well-defined Bullish Bat harmonic pattern, a structure often associated with short-term reversals after corrective phases.
The pattern began with the X point near $0.258, followed by a strong impulsive rally toward point A. Price then retraced to point B, rebounded to point C, and finally completed the structure at point D near $0.288. This D zone typically acts as the potential reversal area for the Bat pattern.
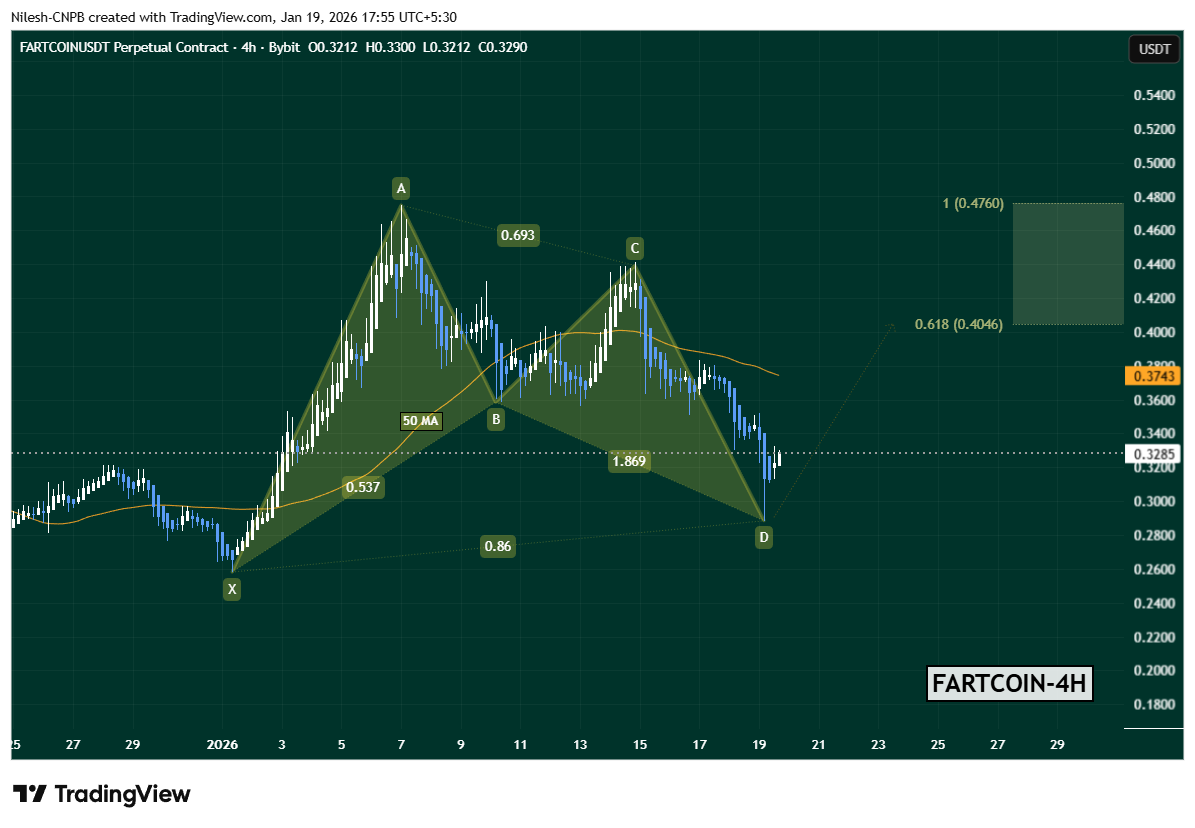
FARTCOIN Daily Chart/Coinsprobe (Source: Tradingview)
Following the completion of point D, FARTCOIN has already shown early signs of stabilization, bouncing back toward $0.3285. This initial reaction suggests that sellers may be losing momentum at current levels.
Key Levels That Could Decide the Move
One key level now in focus is the 50-period moving average, currently hovering around $0.3743. This level has acted as dynamic resistance in recent sessions and will likely determine whether the rebound gains traction or fades.
If buyers manage to push FARTCOIN above the 50 MA with improving volume, the harmonic projection opens the door for upside targets around:
This zone historically represents the area where Bat-pattern-driven moves tend to pause or face profit-taking.
On the flip side, the bullish setup remains valid only as long as price holds above the D-point support near $0.288. A decisive breakdown below this level would invalidate the harmonic structure and could expose FARTCOIN to deeper downside before any meaningful recovery attempt.
Bottom Line
Despite the ongoing market-wide weakness, Fartcoin’s chart is showing early signs of a technical rebound setup. The completion of a Bullish Bat harmonic pattern, combined with a developing bounce from key support, puts FARTCOIN at an important inflection point.
A breakout above the 50 MA could shift short-term momentum back in favor of the bulls, while failure to hold the D-point support would keep bears in control. For now, traders will be watching closely to see whether this harmonic signal translates into a sustained recovery or turns out to be another false start in a volatile market.
Disclaimer: The views and analysis presented in this article are for informational purposes only and reflect the author’s perspective, not financial advice. Technical patterns and indicators discussed are subject to market volatility and may or may not yield the anticipated results. Investors are advised to exercise caution, conduct independent research, and make decisions aligned with their individual risk tolerance.
About Author: Nilesh Hembade is the Founder and Lead Author of Coinsprobe, with over 5 years of experience in the cryptocurrency and blockchain industry. Since launching Coinsprobe in 2023, he has been providing daily, research-driven insights through in-depth market analysis, on-chain data, and technical research.
Disclaimer: The information on this page may come from third parties and does not represent the views or opinions of Gate. The content displayed on this page is for reference only and does not constitute any financial, investment, or legal advice. Gate does not guarantee the accuracy or completeness of the information and shall not be liable for any losses arising from the use of this information. Virtual asset investments carry high risks and are subject to significant price volatility. You may lose all of your invested principal. Please fully understand the relevant risks and make prudent decisions based on your own financial situation and risk tolerance. For details, please refer to
Disclaimer.
Related Articles
BTC rises 0.52% in 15 minutes: Major capital net inflows to exchanges and multiple market resonance driving the move
2026-03-20 21:15 to 21:30 (UTC), BTC recorded +0.52% return in 15 minutes, with a price range of 70124.0 to 70586.6 USDT, and amplitude of 0.66%. This round of volatility occurred against a backdrop of increased market attention and heightened fluctuations, with both on-chain and market participants showing highly active behavior.
The main driver of this volatility was whale funds (entities holding >=1,000 BTC) making a net inflow of 4,091.39 BTC to exchanges within 24 hours, data significantly exceeding the average for the same period. Concentrated net inflows
GateNews1h ago
Bitcoin Has Stabilized, But Investors Are Paying Up for Downside Protection: VanEck
Bitcoin's volatility has decreased to around $70,000, but traders are still heavily investing in downside protection. Although premiums for puts have dropped, they remain high historically, suggesting caution among investors. This defensiveness may signal an impending price bottom, as similar market conditions in the past have led to recoveries.
Decrypt2h ago
Cardano Flashes Weekly Buy Signal As ADA Holds Key $0.23 Support
Cardano is trying to shake off a bruising stretch of price weakness, and a fresh technical signal is giving traders a reason to pay attention again. Crypto analyst Ali Martinez said ADA has printed a TD Sequential buy signal on the weekly chart, showing a “black 9” that often appears when a
BlockChainReporter3h ago
Ethereum Approaches Cycle Low as Bitmain Indicates Violent Belief
The article explores Ethereum's potential market bottom, highlighting its correlation with past S&P 500 trends and significant institutional investment by Bitmain. Despite mixed market sentiment, historical patterns suggest possible recovery.
CryptoBreaking5h ago
Analyst: If Bitcoin falls below the $66,000 support level, it may trigger a 10%-20% correction
Gate News reported that on March 20, Chartered Market Technician (CMT) Aksel Kibar stated on March 21 that the lower support boundary of Bitcoin's potential rising wedge formation is located at 66,000, and a breakdown below this level could trigger a bearish reversal. Aksel Kibar pointed out that rising wedges, as a classic technical pattern, typically appear at the end of uptrends, signaling price momentum exhaustion. Historical data shows that after similar downside breakdowns are confirmed, the average pullback ranges from 10%-20%.
GateNews6h ago
