Author: ARK Invest
Translation: Felix, PANews (Content has been edited)
ARK Invest releases its flagship research report “Big Ideas” every year. The report excludes short-term disturbances and aims to identify and interpret technologies that are reshaping the global economy. This year, ARK explores 13 major concepts spanning AI, robotics, energy, blockchain, space, and biology, which are creating synergistic effects, redefining productivity, capital allocation, and competitive advantages across industries. This article excerpts content from fields like AI and blockchain. Below are the details.
The Age of Accelerated Growth, with AI as the Core Engine, Accelerating the Development of Five Major Innovation Platforms and Triggering a Turning Point in Macroeconomic Growth.
Technology convergence is accelerating. The five major innovative technologies (AI, public blockchain, robotics, energy storage, and multi-omics) are becoming increasingly interdependent, as improvements in one technology unlock new capabilities in others.
Reusable rockets that deliver autonomous Mobility AI chips into orbit could become key to expanding next-generation cloud services. Multi-omics data authorized within digital wallets may power neural networks, driving the development of precision medicine to cure rare diseases.
The world is entering an unprecedented technology investment cycle. Each disruptive technology could have profound macroeconomic impacts.
AI Infrastructure
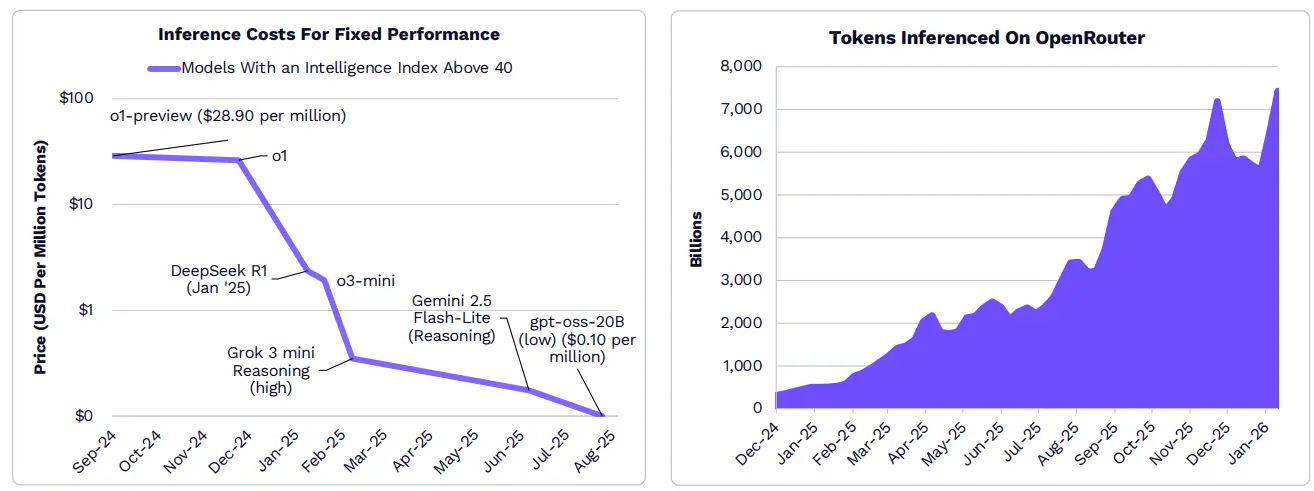
As inference costs decline, demand for AI is rapidly growing.
From certain indicators, inference costs have fallen over 99% in the past year. With the surge in AI-native applications, the cost reductions are fueling explosive growth in the number of inference tokens used by developers, businesses, and consumers. Since December 2024, the computational demand for OpenRouter (a unified API for accessing large language models) has increased 25-fold.
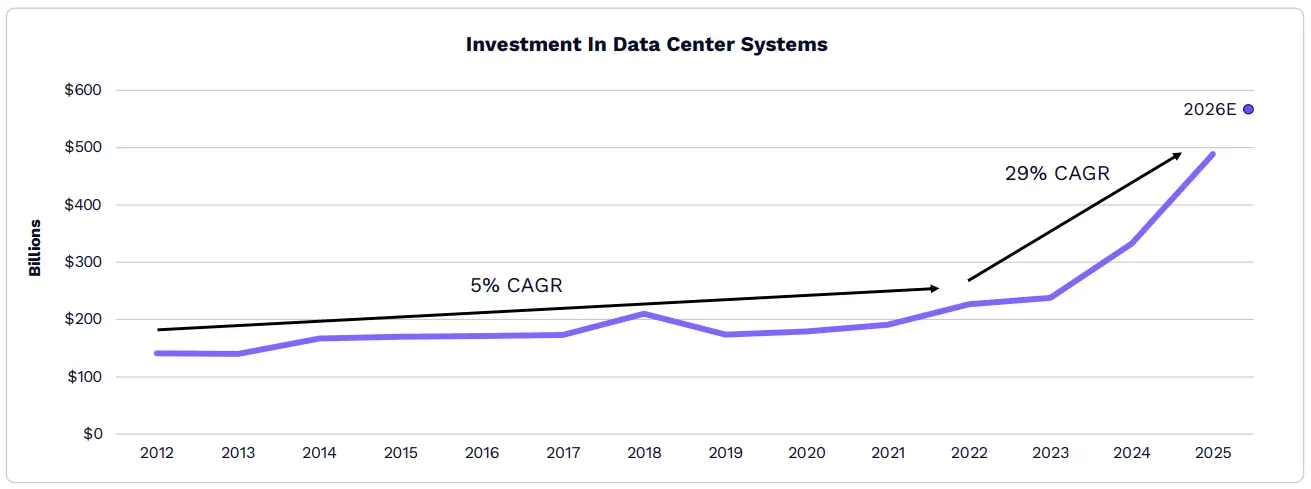
Since the “ChatGPT Moment,” the growth rate of data center systems has accelerated from 5% to 29%, with annual growth continuing to rise.
By 2025, annual investment in data center systems is expected to reach approximately $500 billion, nearly 2.5 times the average from 2012 to 2023. According to ARK research, such investments will continue to grow, potentially doubling by 2030 to about $1.4 trillion.
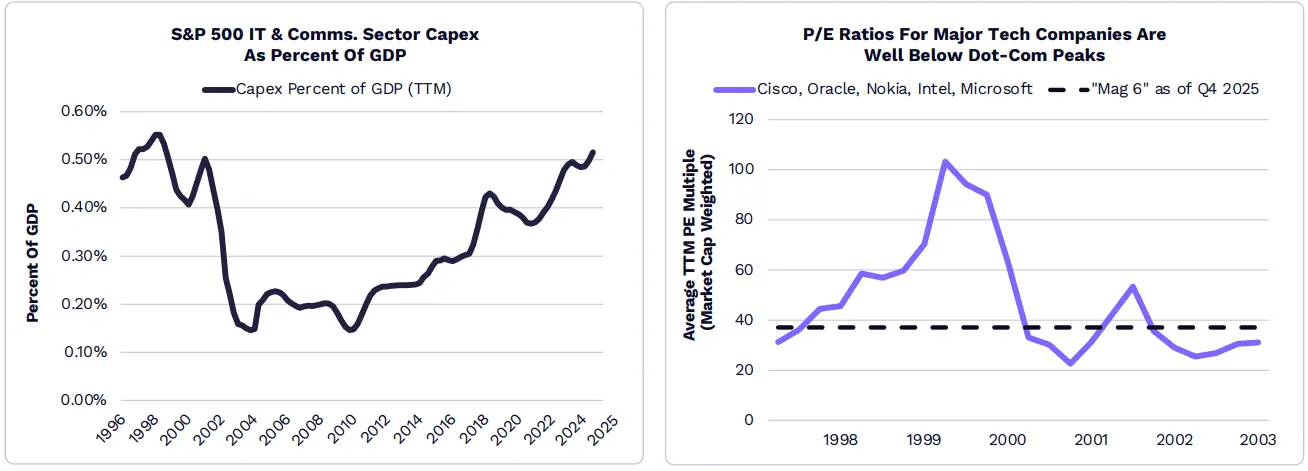
Technology capital expenditures have reached levels seen during the tech and telecom boom, but valuations of tech companies are far below those levels.
According to ARK research, large-scale data center operators will spend over $500 billion in capital expenditures in 2026, nearly three times the $135 billion spent in 2021 (before the ChatGPT boom in 2022). Although capital expenditure as a percentage of GDP in the IT and communications services sectors has reached its highest level since 1998, the P/E ratios of tech companies remain well below the peaks during the tech bubble era.
NVIDIA faces fiercer competition.
Early investments in AI chips, software, and networking have allowed NVIDIA’s GPUs to capture 85% market share with a 75% gross margin. Today, competitors like AMD and Google are catching up in certain areas, such as inference for small language models. NVIDIA’s Grace Blackwell rack systems lead in large model inference, supporting the most advanced foundational models.

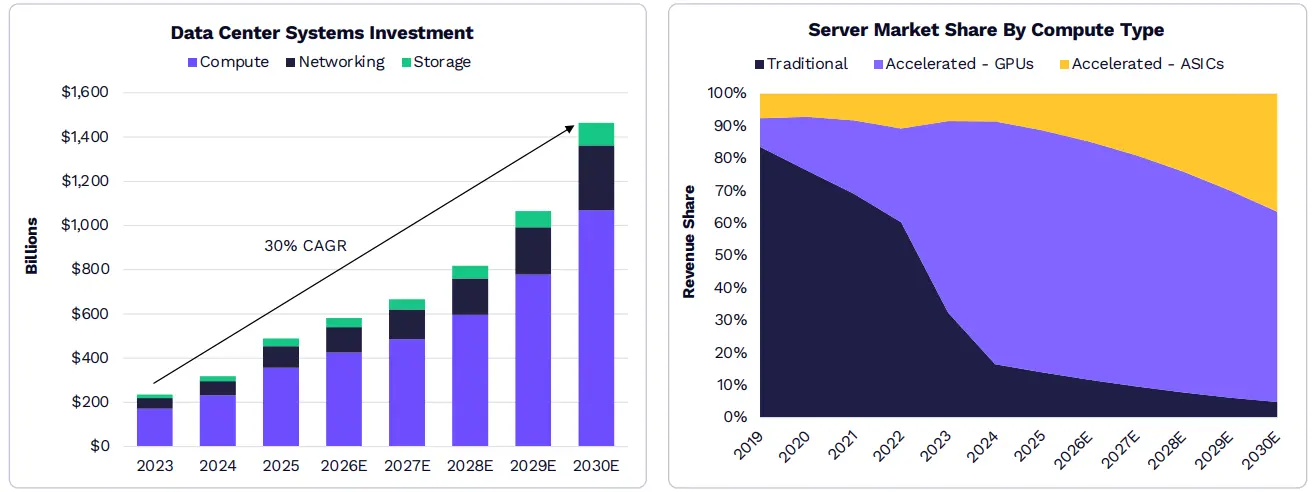
AI demand will drive sustainable growth in infrastructure.
As AI workloads expand in enterprise and consumer environments, AI infrastructure investments could exceed $1.4 trillion by 2030, mostly for accelerating servers. ARK research indicates that ASICs designed by companies like Broadcom and Amazon’s Annapurna Labs will continue to dominate the market, as AI labs and large-scale enterprises seek cost-effective computing power.
Bitcoin
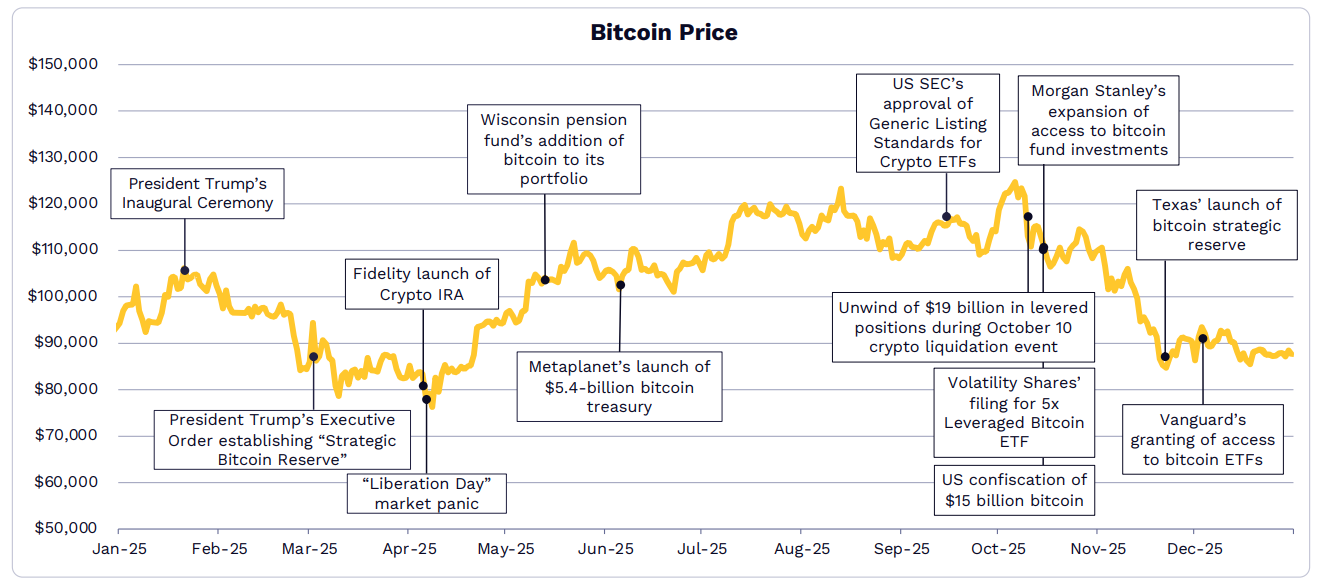
Bitcoin is gradually becoming a leader in a new asset class for institutions.
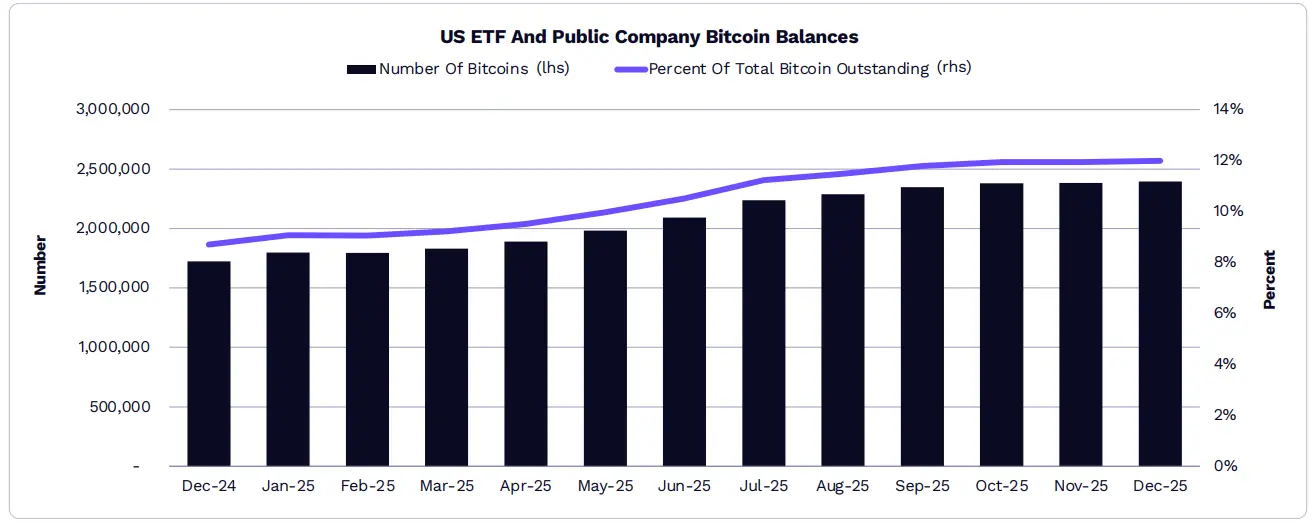
U.S. ETFs and listed companies hold 12% of all Bitcoin.
By 2025, Bitcoin ETF holdings are projected to grow 19.7%, from about 1.12 million coins to approximately 1.29 million coins; meanwhile, holdings by listed companies increased 73%, from about 598,000 coins to approximately 1.09 million coins. As a result, the total share of Bitcoin held by ETFs and listed companies rose from 8.7% to 12%.
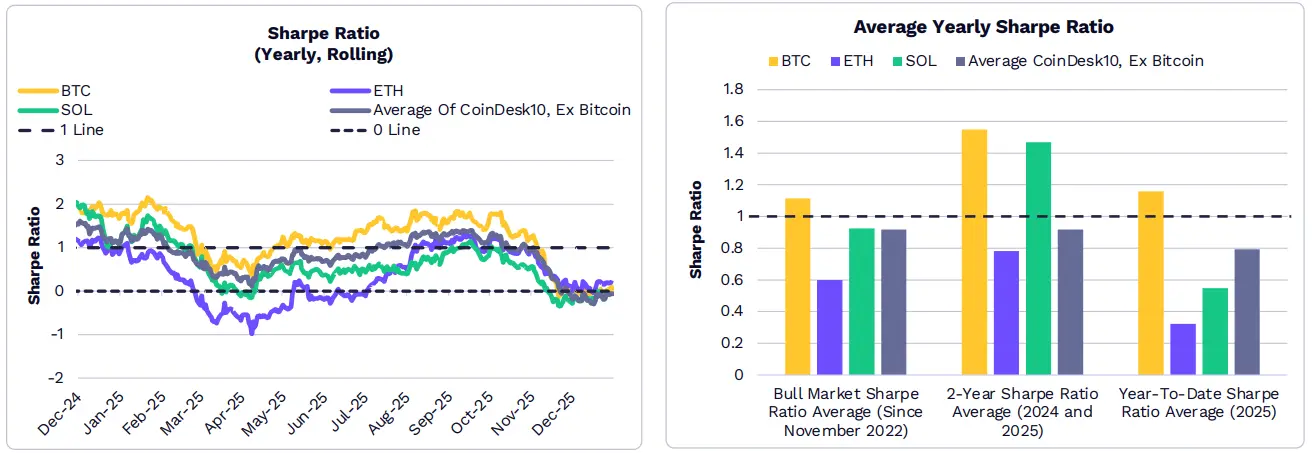
Bitcoin’s annual risk-adjusted return (Sharpe ratio) has long been higher than the entire crypto market.
Throughout most of 2025, Bitcoin’s risk-adjusted returns outperformed most other large-cap cryptocurrencies and indices. Since the recent cycle lows (November 2022), early 2024, and early 2025, Bitcoin’s average annualized Sharpe ratio has also exceeded the averages of Ethereum, SOL, and the other nine components of the CoinDesk 10 index.
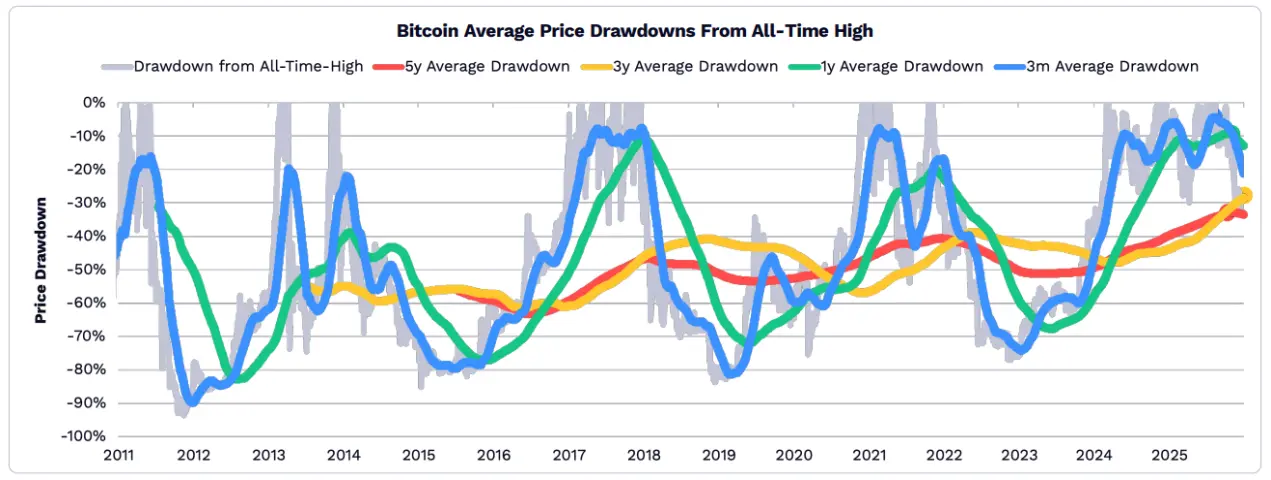
In 2025, Bitcoin’s price relative to its all-time high has experienced a moderation in decline.
As Bitcoin’s role as a safe-haven asset strengthens, its volatility has decreased. Over time spans of 5 years, 3 years, 1 year, and 3 months, Bitcoin’s declines in 2025 are relatively milder compared to historical levels.
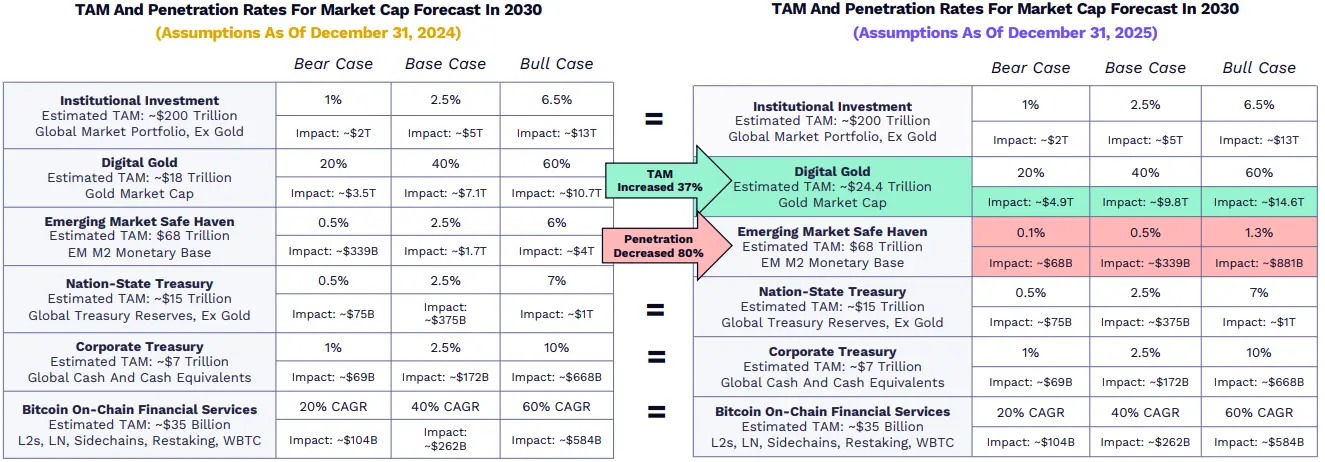
ARK’s assumptions about Bitcoin’s growth have shifted, but forecasts remain largely unchanged.
ARK’s projections for Bitcoin in 2030 have been quite stable, with two key assumptions changing: as digital gold, its potential market (TAM) grew 37% after a 64.5% surge in gold market value in 2025; as an emerging market safe-haven asset, its forecasted penetration rate has decreased by 80% to reflect the rapid adoption of stablecoins in developing countries.
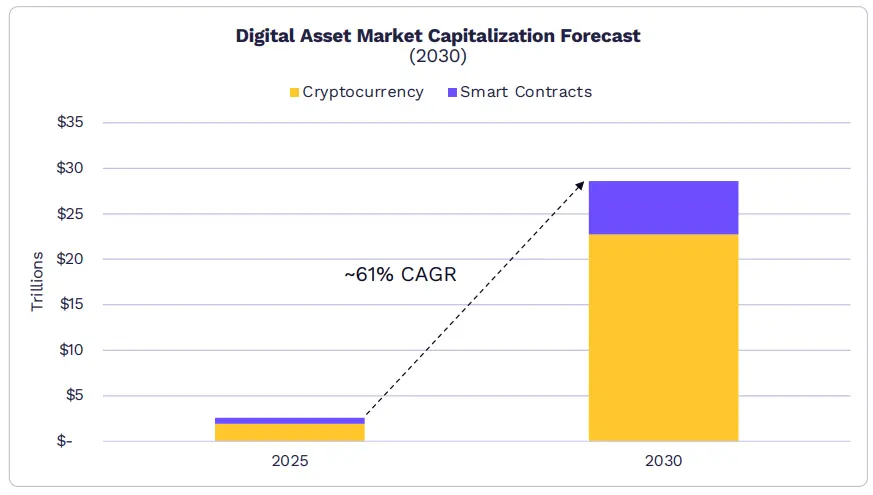
The market value of digital assets could reach $28 trillion by 2030.
The market size of smart contracts and purely digital currencies (which serve as stores of value, mediums of exchange, and accounting units on public blockchains) could grow at about 61% annually, reaching $28 trillion by 2030. ARK estimates Bitcoin could account for 70% of the market share, with the rest dominated by smart contract networks like Ethereum and Solana.
- Based on ARK’s forecasts, Bitcoin is likely to dominate the crypto market over the next five years with a CAGR of about 63%, growing from nearly $2 trillion to approximately $16 trillion by 2030.
- The market cap of smart contracts could grow at 54% annually, reaching about $6 trillion by 2030, with annual revenues of approximately $192 billion and an average fee rate of 0.75%.
- Two to three Layer 1 platforms will hold most of the market share, but their market value will derive more from their monetary premium (value storage and reserve asset characteristics) rather than discounted cash flows.
Tokenized Assets
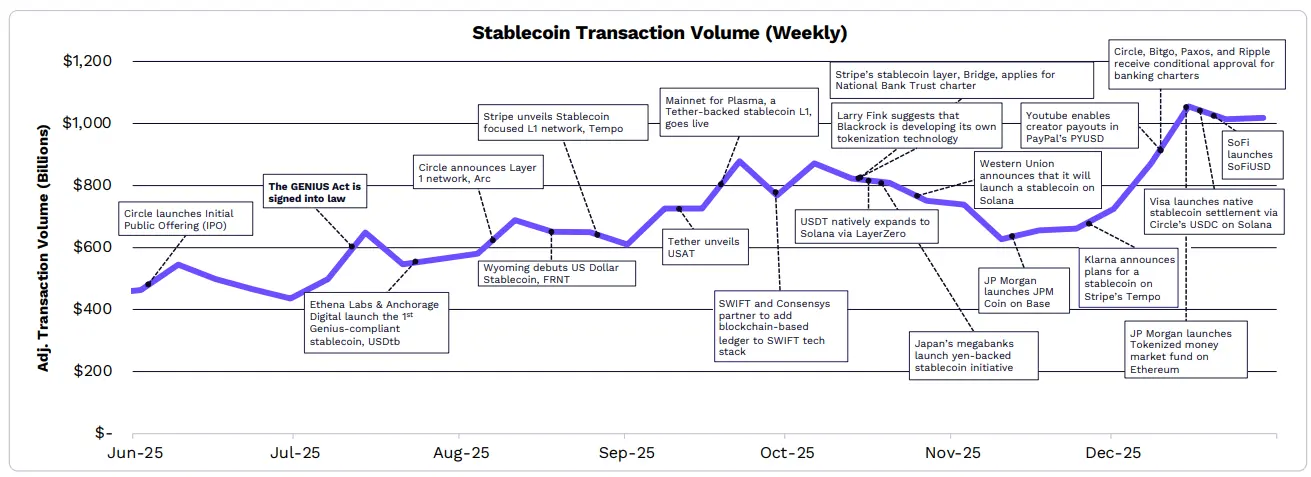
Due to the “GENIUS Act,” financial institutions are reassessing their stablecoin and tokenization strategies.
With regulatory clarity brought by the “GENIUS Act,” stablecoin activity has surged to record highs. Many companies and institutions have announced their own stablecoins, and BlackRock has revealed plans to develop an internal tokenization platform. Major stablecoin issuers like Tether, Circle, and fintech firms are launching/supporting Layer 1 blockchains optimized for stablecoins.
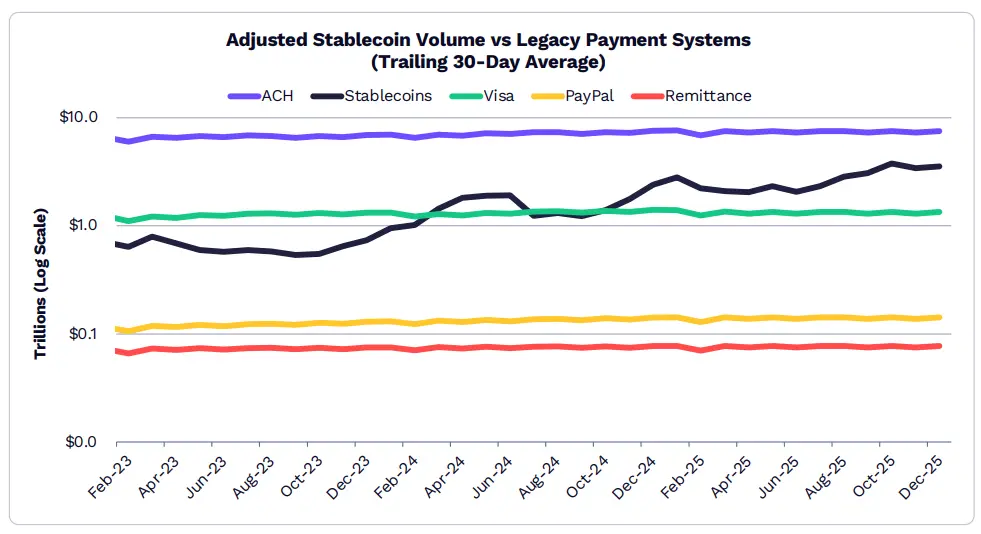
Stablecoin trading volume reached $3.5 trillion in December, far surpassing most traditional payment systems.
In December 2025, the 30-day moving average of stablecoin trading volume was $3.5 trillion, 2.3 times the total value of Visa, PayPal, and remittances.
Circle’s stablecoin USDC dominates with about 60% market share, followed by Tether’s USDT with about 35%.
In 2025, stablecoin supply grew approximately 50%, from $210 billion to $307 billion, with USDT and USDC accounting for 61% and 25%, respectively.
Sky Protocol is the only stablecoin issuer besides other stablecoin providers to have a market cap exceeding $10 billion by the end of 2025.
Notably, PayPal’s PYUSD market cap grew more than sixfold, reaching $3.4 billion.
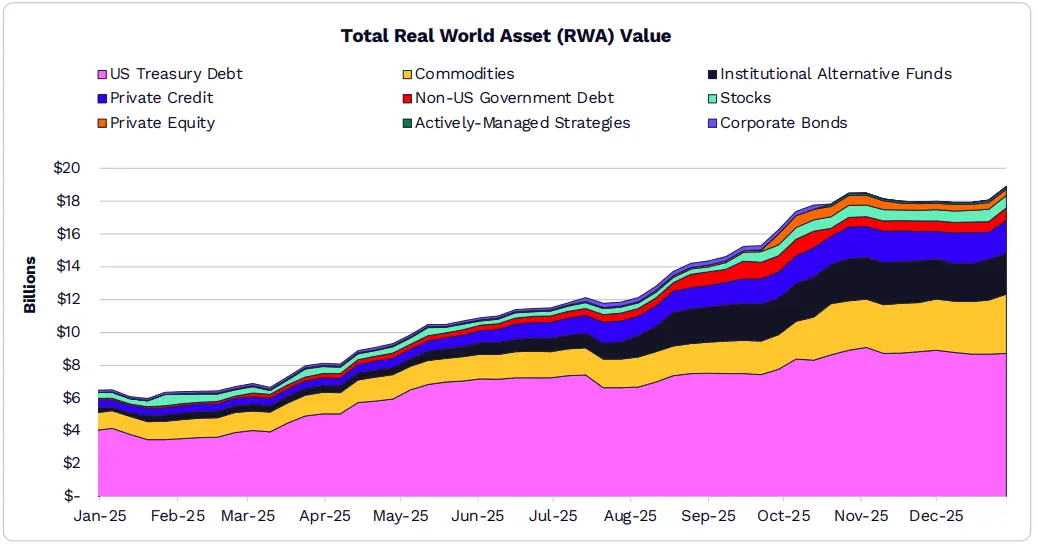
Driven by U.S. Treasuries and commodities, the tokenized asset market doubled in 2025, reaching $190 billion.
The market cap of RWA (Real-World Assets) grew 208% in 2025, reaching $18.9 billion.
BlackRock’s $1.7 billion BUIDL money market fund is one of the largest products, accounting for 20% of the $9 billion U.S. Treasury bonds.
Tokenized gold products from Tether (XAUT) and Paxos (PAXG) lead the tokenized commodities market, with market caps of $1.8 billion and $1.6 billion, respectively, together representing 83%.
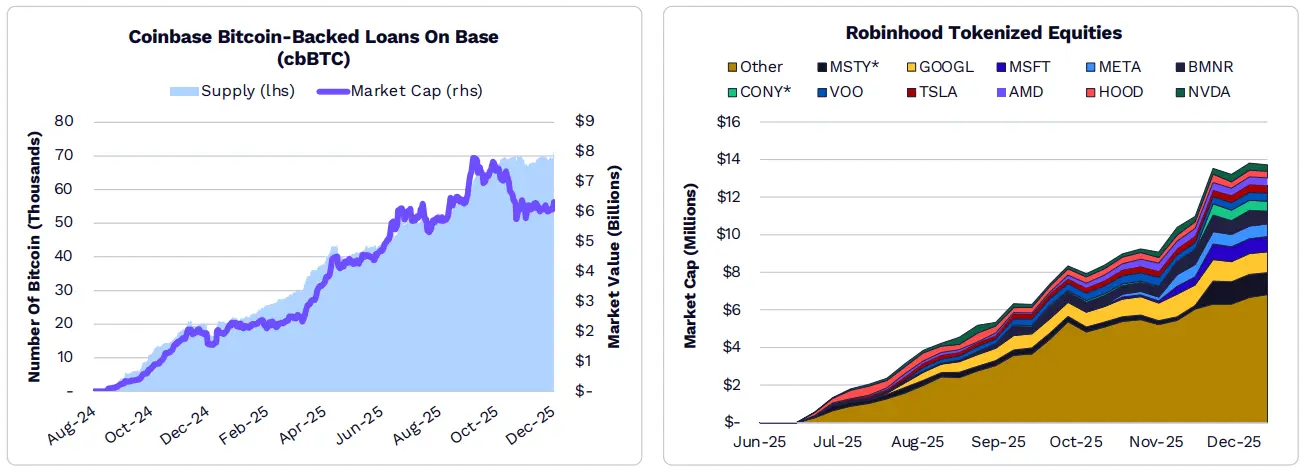
Tokenized public equities amount to nearly $75 million.
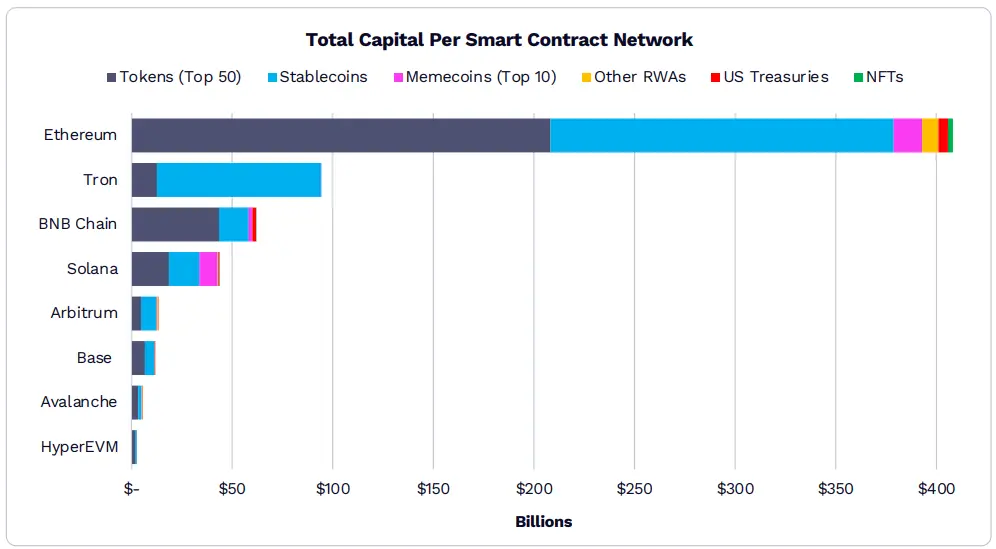
Ethereum remains the preferred blockchain for on-chain assets.
The total value of assets on Ethereum now exceeds $400 billion. Among the eight most popular blockchains, 90% of the market cap on seven chains is supported by stablecoins and the top 50 tokens.
On blockchains other than Solana, meme coins account for about 3% or less of the market cap. On Solana, meme coins account for about 21%.
RWA tokenization is expected to become one of the fastest-growing categories. Since most value is stored off-chain, off-chain assets still represent the greatest growth opportunity for on-chain adoption.
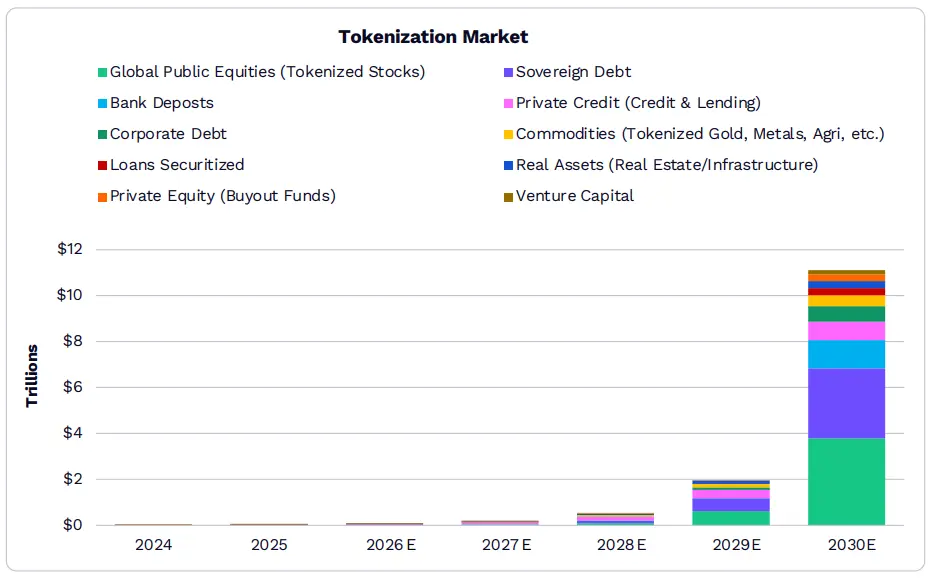
By 2030, the global market size of tokenized assets could exceed $11 trillion.
According to our research, the market size of tokenized assets could grow from $19 billion to $11 trillion, accounting for about 1.38% of all financial assets at that time.
While sovereign debt currently dominates tokenization, over the next five years, the on-chain value of bank deposits and global listed stocks may surpass current levels.
ARK believes widespread tokenization will depend on regulatory clarity and improvements in institutional-grade infrastructure.
Traditional companies are building their own infrastructure to expand their on-chain influence.
Traditional firms are developing their own on-chain infrastructure. Circle (Arc), Coinbase (Base, cbBTC), Kraken (Ink), OKX (X Layer), Robinhood (Robinhood Chain), and Stripe (Tempo) are launching their own branded Layer 1/Layer 2 networks to support their products, such as Bitcoin-backed loans, tokenized stocks and ETFs, and stablecoin-based payment channels.
DeFi Applications
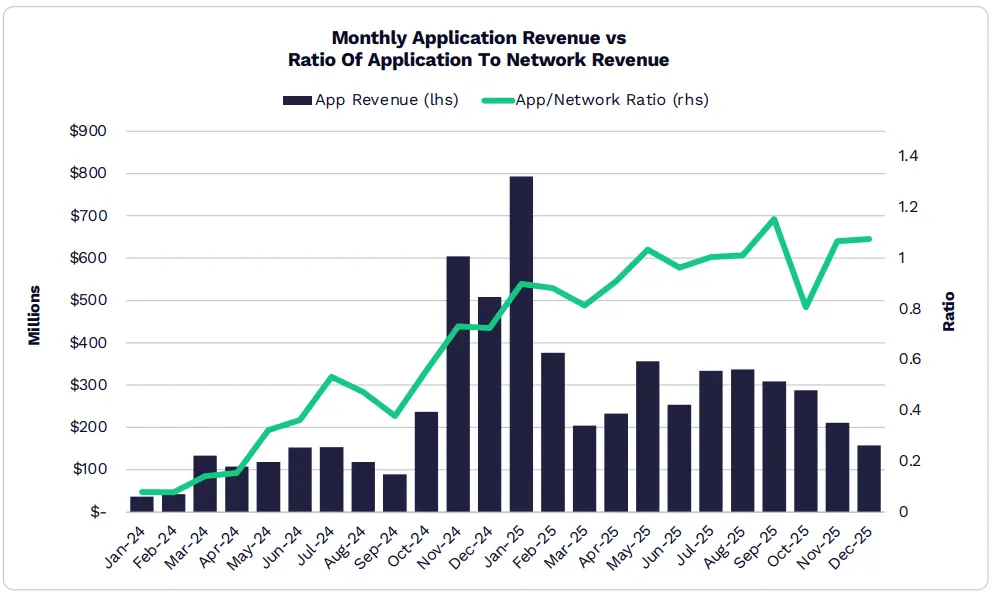
Digital asset value capture is shifting from networks to applications.
The network is gradually transforming into a utility, transferring user economic benefits and profit margins to the application layer.
Led by Hyperliquid, Pump.fun, and Pancakeswap, the total application revenue in 2025 reached a record high of about $3.8 billion.
One-fifth of all application revenue in 2025 came from January, the highest monthly revenue ever recorded.
Today, 70 applications and protocols have a monthly recurring revenue (MRR) exceeding $1 million.
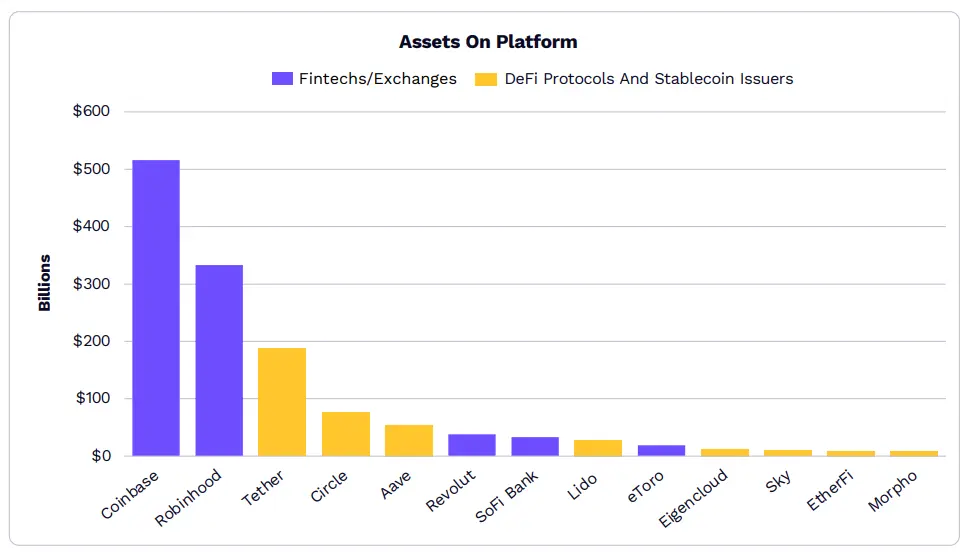
The asset size of DeFi and stablecoin issuers is catching up with many fintech companies.
The gap in asset size between traditional fintech platforms and crypto-native platforms is narrowing, indicating a convergence of traditional and on-chain infrastructure.
DeFi protocols like liquidity staking or lending platforms are attracting institutional capital and expanding rapidly.
The TVL of the top 50 DeFi platforms has entered the billion-dollar club, with the top 12 protocols each exceeding $5 billion.
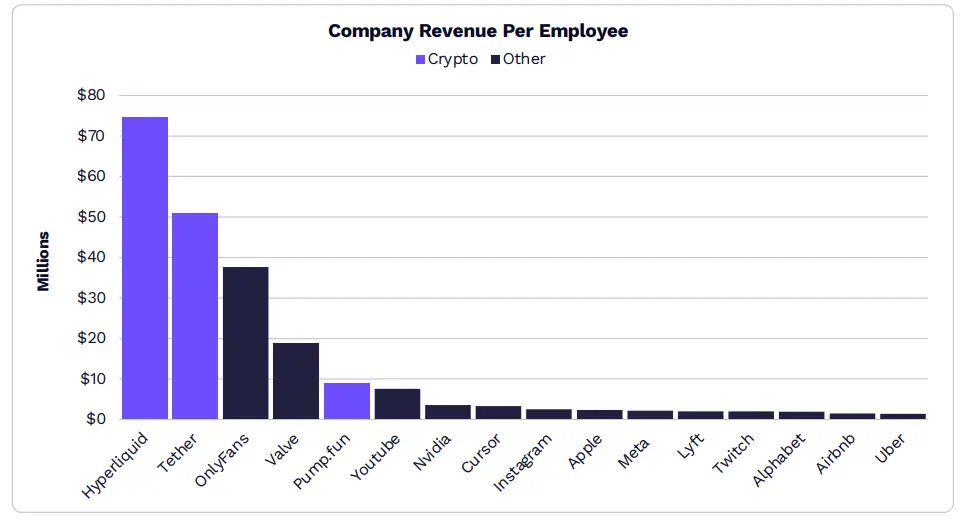
The most revenue-efficient companies globally include Hyperliquid, Tether, and Pump.fun.
By 2025, Hyperliquid, with just 15 employees, will generate over $800 million in annual revenue.
Through on-chain verticals like perpetual contracts, stablecoins, and meme coins, Hyperliquid is attracting users and capital at an astonishing scale, with clear product-market fit.
On-chain businesses and protocols are redefining productivity, as just a handful of people can generate revenues and profits comparable to world-class companies.
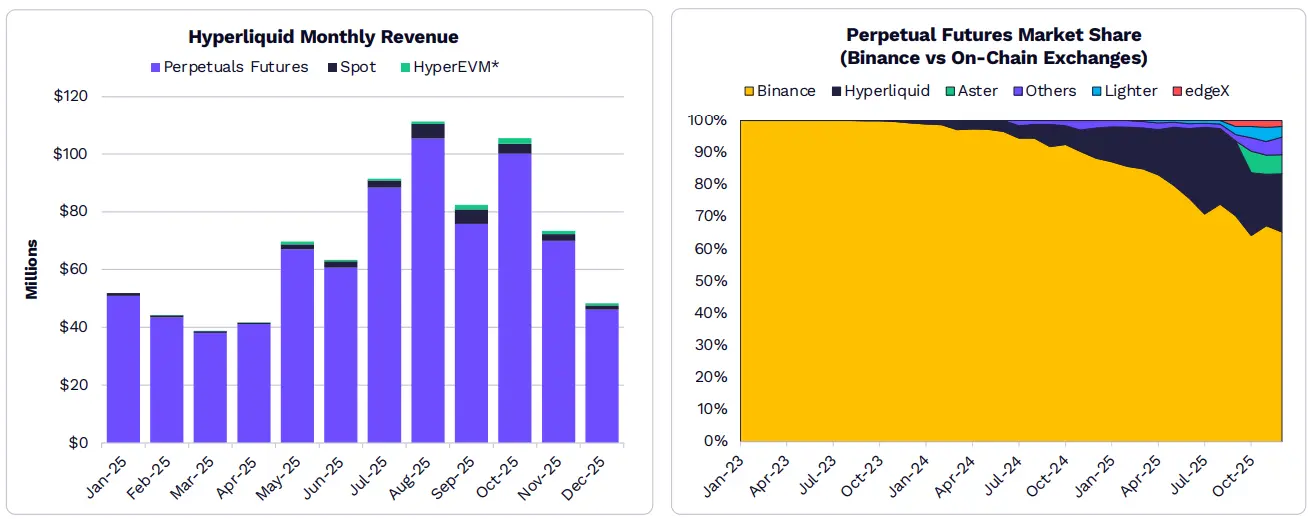
Led by Hyperliquid, DeFi derivatives are capturing market share from Binance’s perpetual contracts.
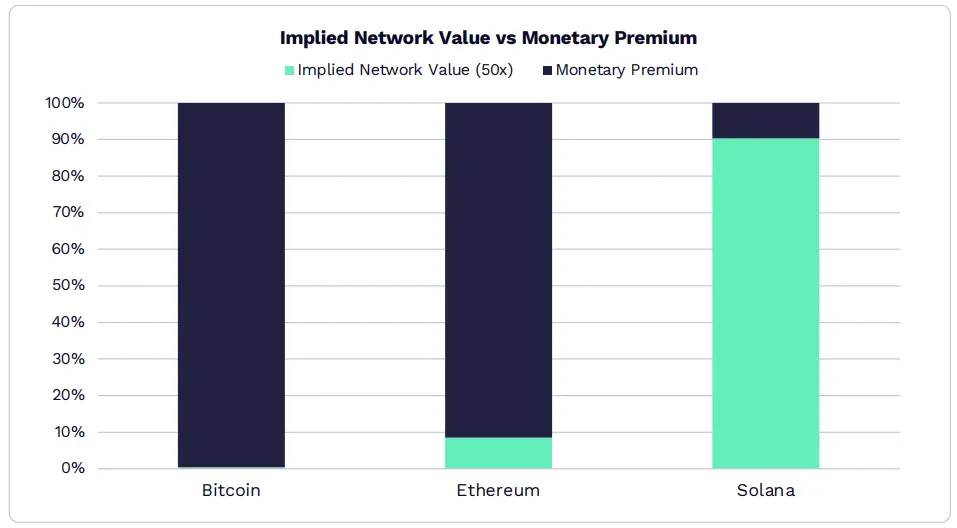
Layer 1 networks are evolving from revenue-generating networks into monetary assets.
Using a 50x revenue multiple, over 90% of Ethereum’s market cap is attributed to its role as a monetary asset.
Solana generated $1.4 billion in revenue, demonstrating that 90% of its valuation comes from network utility.
According to ARK research, only a few digital assets can retain their monetary properties and serve as highly liquid stores of value.
Disclaimer: The information on this page may come from third parties and does not represent the views or opinions of Gate. The content displayed on this page is for reference only and does not constitute any financial, investment, or legal advice. Gate does not guarantee the accuracy or completeness of the information and shall not be liable for any losses arising from the use of this information. Virtual asset investments carry high risks and are subject to significant price volatility. You may lose all of your invested principal. Please fully understand the relevant risks and make prudent decisions based on your own financial situation and risk tolerance. For details, please refer to
Disclaimer.
