
Key Takeaways
-
Monad (MON) has dropped nearly 41% over the past two months but is showing early signs of stabilization.
-
Price action suggests a potential double bottom pattern forming near the $0.018 support zone.
-
Buyers have repeatedly defended the same support level, hinting at fading selling pressure.
-
A move above the 50-day moving average could strengthen the short-term bullish outlook.
-
A confirmed breakout above the $0.02970 neckline may open the door for a stronger recovery rally.
Monad (MON), the native token of the Monad Layer-1 blockchain, has been under pressure in recent weeks. The token is down roughly 41% over the past 60 days, driven by a slowdown in TVL growth and a decline in application-level revenue across the ecosystem.
However, sentiment may be starting to shift. MON posted a 12% bounce today, and more importantly, its price structure on the daily chart is beginning to show early signs of a bullish reversal — suggesting the downside momentum could be losing steam.
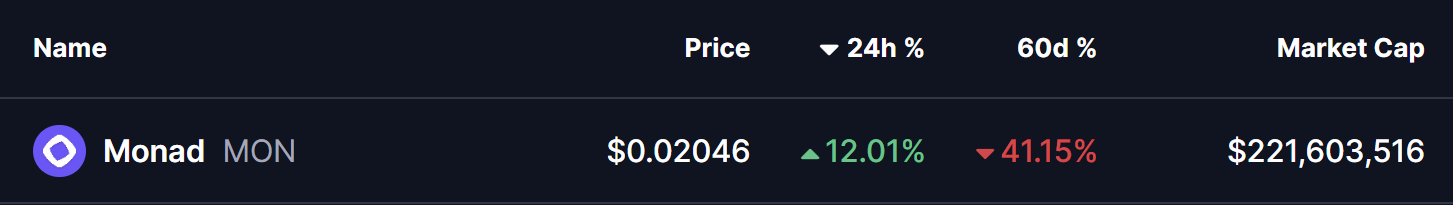
Source: Coinmarketcap
Double Bottom Pattern in Play
On the daily timeframe, MON appears to be forming a potential double bottom pattern, a classic bullish reversal structure that often develops near the end of extended downtrends.
The first bottom was formed when MON dropped toward the $0.018 support zone, followed by a rebound that carried price back toward the neckline resistance near $0.02970. That recovery attempt was rejected, sending MON back down to retest the same support level.
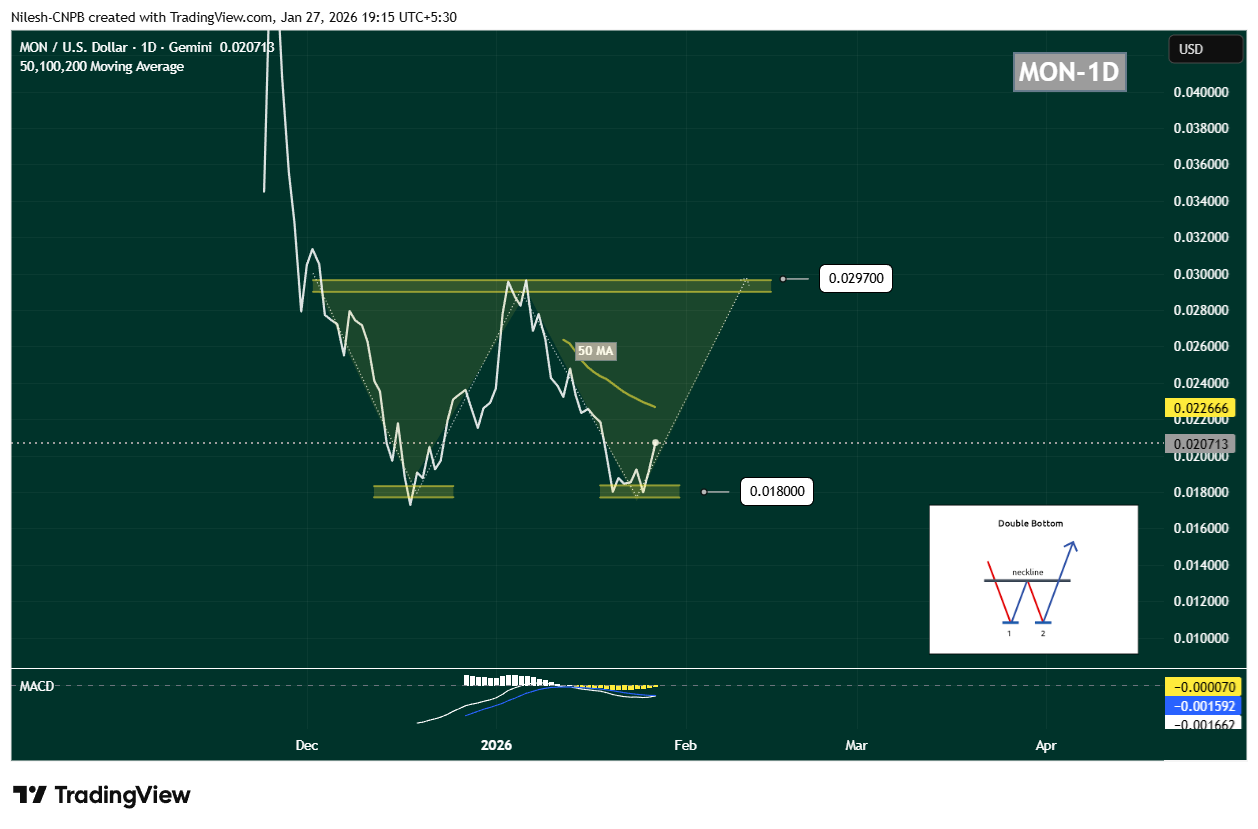
Monad (MON) Daily Chart/Coinsprobe (Source: Tradingview)
What’s notable this time is buyer behavior. Once again, demand emerged around $0.018, preventing a breakdown and forming the second bottom of the structure. MON is currently trading near $0.02071, indicating that selling pressure may be fading.
Momentum indicators are starting to support this view. The MACD is showing early signs of a potential bullish crossover, often seen as an initial signal that downside momentum is weakening and buyers may be preparing to step back in.
What’s Next for Monad (MON)?
For this bullish setup to gain credibility, MON needs to reclaim the 50-day moving average, which is currently positioned near $0.02266. A sustained move above this level would signal a shift in short-term momentum and improve the probability of a recovery rally.
If buyers manage to push price back toward the $0.02970 neckline, the market will be watching closely. A decisive breakout above this resistance, ideally followed by a successful retest, would confirm the double bottom pattern and open the door for a stronger upside move.
On the downside, the $0.018 support zone remains the most critical level to defend. A breakdown below this area would invalidate the bullish structure and likely expose MON to another leg of downside or extended consolidation.
Bottom Line
Despite recent weakness, MON’s technical structure is starting to look constructive. The repeated defense of identical lows, the emergence of a double bottom pattern, and improving momentum signals suggest that Monad could be approaching a potential turning point.
If key support continues to hold and the token reclaims its short-term moving averages, MON may be setting the stage for a recovery phase — especially if broader market conditions stabilize in the days ahead.
Disclaimer: The views and analysis presented in this article are for informational purposes only and reflect the author’s perspective, not financial advice. Technical patterns and indicators discussed are subject to market volatility and may or may not yield the anticipated results. Investors are advised to exercise caution, conduct independent research, and make decisions aligned with their individual risk tolerance.
About Author: Nilesh Hembade is the Founder and Lead Author of Coinsprobe, with over 5 years of experience in the cryptocurrency and blockchain industry. Since launching Coinsprobe in 2023, he has been providing daily, research-driven insights through in-depth market analysis, on-chain data, and technical research.
Disclaimer: The information on this page may come from third parties and does not represent the views or opinions of Gate. The content displayed on this page is for reference only and does not constitute any financial, investment, or legal advice. Gate does not guarantee the accuracy or completeness of the information and shall not be liable for any losses arising from the use of this information. Virtual asset investments carry high risks and are subject to significant price volatility. You may lose all of your invested principal. Please fully understand the relevant risks and make prudent decisions based on your own financial situation and risk tolerance. For details, please refer to
Disclaimer.
Related Articles
Bitcoin Faces Crucial Supply Test – Understanding the URPD Cluster Near $73,000
The cryptocurrency industry is currently experiencing a very high psychological and technical level of consolidation. Most of the news relating to the market will typically focus on price movement. Well-established analysts are analyzing on-chain statistics to identify the current strength of the pr
BlockChainReporter2h ago
Market is overly panicked? MicroStrategy founder: Bitcoin has already hit bottom, and the quantum threat is needless worry
Michael Saylor asserts that Bitcoin has already finished bottoming at $60k, and he believes concerns about threats from quantum computers are overblown. He predicts that in the future, Bitcoin will become the core of a digital credit system, and he notes that there is limited selling pressure in the market, which could help drive the next bull cycle. Mizuho also has a positive assessment of the company’s future performance.
CryptoCity2h ago
$LINK and $PIPPIN Outshine AI Agent Projects By Social Activity
The article discusses the Top 10 AI Agent Projects in cryptocurrency based on social activity, revealing Chainlink ($LINK) as the leader. It highlights engagement and interaction metrics for various projects, indicating strong interest and demand in the market.
BlockChainReporter5h ago
Ethereum Network Activity Claims New ATH Indicating Bullish Divergence
The Ethereum network has reached a new all-time high in activity, signaling its growing utility beyond speculation. Factors like L2 scaling and DeFi are driving this surge, suggesting strong long-term growth potential for Ethereum ($ETH).
BlockChainReporter5h ago
FLOW Recovers From Prolonged Downtrend As Buy-Side Liquidity Builds, Triggering a Potental 22% Br...
The Flow (FLOW) coin is attracting investor interest as its on-chain market continues to pick up fresh momentum, according to a revelation disclosed today by financial analyst Crypto Patel. As per the data posted today, the cryptocurrency has developed a clear bull structure and is displaying a
BlockChainReporter6h ago
PEPE Price Holds Support as Bearish Bets Build Pressure
Key Insights:
PEPE price stabilizes near strong support despite sustained negative funding rates, highlighting a clear divergence between trader sentiment and actual market behavior.
Declining open interest and reduced liquidation activity indicate leverage reset, suggesting the market has c
CryptoNewsLand6h ago
