
The wider crypto market is having a rough time right now. Volatility is high, sentiment feels fragile, and many charts are still stuck below old resistance levels.
In the middle of all that, the Canton price is doing the opposite. Instead of fighting overhead supply, CC is pressing right up against price discovery, trading in an area where historical resistance is thin.
That’s what makes the chart stand out. Other assets keep stalling on bounces, the CC price continues to hold its structure. Pullbacks stay shallow, dips get bought quickly, and price keeps grinding higher. It’s a very different look compared to most of the market.
- What Stands Out on the Canton Chart
- The Levels That Matter Most for CC
- Why Canton Keeps Standing Out
- What’s Next for CC?
What Stands Out on the Canton Chart
Looking at the chart shared by Sjuul, the CC price has already pushed above prior highs and is now hovering around the $0.17–$0.18 area, with recent action near $0.1739. At this level, there’s very little selling pressure sitting overhead, which is why price discovery is even part of the conversation. Once an asset moves into this kind of zone, price can travel faster simply because there aren’t many historical levels for sellers to lean on.
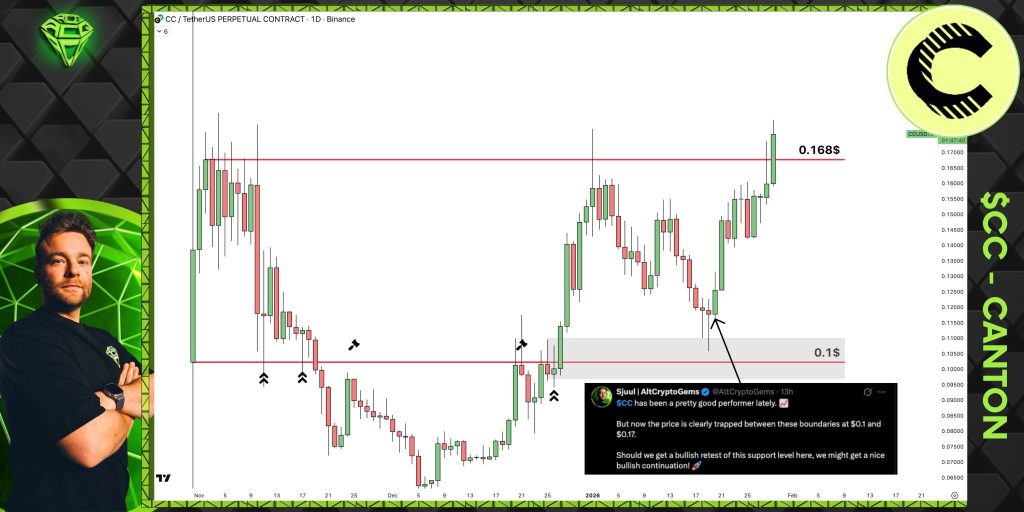
Source: X/@AltCryptoGems
Recent candles tell a pretty clean story. Each pause around $0.165–$0.17 has been followed by continuation, not rejection. Instead of sharp pullbacks, the CC price keeps printing higher lows, stepping up from earlier support near $0.150 and $0.158. That pattern points to buyers staying engaged rather than backing off. Volume has also stayed steady on pushes above $0.16, which helps confirm that demand hasn’t faded yet.
The Levels That Matter Most for CC
Even in price discovery territory, structure still matters. The most important level right now is the last breakout zone between roughly $0.155 and $0.160. That area has flipped into support and is doing most of the heavy lifting for the trend. As long as the CC price holds above it, the broader move remains intact.
If price slips back below $0.155, it wouldn’t automatically mean the move is over. It would, however, increase the chances of a deeper pause or a stretch of sideways action, possibly back toward $0.145–$0.150, before any renewed push higher.
On the upside, there’s no clear resistance to focus on above $0.1739, which is why traders tend to watch how price behaves instead of aiming for fixed targets. Strong closes near the highs keep the move alive. Slower, overlapping candles around $0.18 would be the first sign that momentum might be cooling off.
Why Is the Crypto Market Down Today as the Bitcoin Price Dips Below $83K_**
Why Canton Keeps Standing Out
The real difference with the CC price is how it behaves compared to the rest of the market. Many assets are still working through supply from earlier sell-offs. Canton doesn’t have that issue right now. That gives it room to keep pushing even if the broader market remains unsettled.
This kind of divergence doesn’t last forever, but it often sticks around longer than expected. As long as the CC price keeps holding higher lows and avoids sharp reversals, the upside remains open.
What’s Next for CC?
The CC price is sitting at an important stage. Holding above the recent breakout zone keeps price discovery in play and leaves room for further continuation. Losing that structure would likely lead to a period of consolidation instead of an immediate collapse.
For now, Canton remains one of the few charts showing strength while much of the market struggles. As long as price action stays tight and buyers continue to step in on dips, the CC price keeps its advantage.
Disclaimer: The information on this page may come from third parties and does not represent the views or opinions of Gate. The content displayed on this page is for reference only and does not constitute any financial, investment, or legal advice. Gate does not guarantee the accuracy or completeness of the information and shall not be liable for any losses arising from the use of this information. Virtual asset investments carry high risks and are subject to significant price volatility. You may lose all of your invested principal. Please fully understand the relevant risks and make prudent decisions based on your own financial situation and risk tolerance. For details, please refer to
Disclaimer.
Related Articles
PEPE Price Slides as Weak Momentum Signals Further Downside
The Pepe token displays weakening momentum with bearish sentiment prevalent in short-term trading. Oversold conditions fail to ignite recovery, indicating weak demand and cautious trader behavior, while price pressures near the lower Bollinger Band highlight ongoing downside risks.
CryptoFrontNews5m ago
The One Thing That Sets XRP Apart From Every Other Crypto (Most Investors Have No Idea)
David Schwarz said something the other day that most people probably scrolled right past. But if you’re paying attention, it’s actually one of the most profound statements you’ll hear about XRP. And honestly, it puts this asset in a category completely by itself.
Schwarz replied to someone on
CaptainAltcoin16m ago
Pi Coin Price Brewing 22% Breakthrough: Key Indicator "Goes Silent," $0.20 USD Becomes Bulls-Bears Dividing Line
Pi Network (PI) price is hovering around $0.188, with a slight decline intraday but an 11.6% increase this month. Technical analysis indicates the market is approaching a potential reversal point, showing bullish signals and a cup-and-handle pattern. However, short-term momentum depends on the PISI indicator, which is currently near neutral, suggesting that PI has not yet formed a strong upward trend. The key resistance level is at $0.200; a break above this could lead to further gains toward $0.246. The market still needs to wait for changes in capital flow to trigger a breakout.
GateNews19m ago
Bitcoin Market Sentiment Turns Defensive as $685 Million Put Bets Surge
Recent changes have emerged in the Bitcoin derivatives market, with traders investing approximately $685 million in put options over the past 30 days, reflecting cautious market sentiment. This shift demonstrates that investors are transitioning from offensive strategies to risk management, particularly amid growing macroeconomic uncertainty. Rising demand for put options typically signals future price risks, as investors seek to balance between controlling drawdowns and locking in gains.
GateNews21m ago
Pi Network Bullish Pattern Formation, PISI Indicator Shows 22% Breakout Yet to Come
On March 24, Pi Network (PI) was trading near $0.188, with an overall gain of 11.6%. Hidden bullish divergence and a cup and handle pattern indicate potential for a 22% rally if it breaks through the $0.204 neckline. However, the PISI indicator is near zero, suggesting a lack of independent momentum. The CMF indicator has turned positive, hinting that large capital may be re-establishing positions. The key support level is $0.182, and if it breaks below $0.168, the cup and handle pattern will be invalidated.
MarketWhisper21m ago
Retail Investor Exodus Intensifies: Stock Trading Share Halved, Capital Floods Into Gold for Safety
US retail investors' participation in the stock market has noticeably declined, with retail trading volume dropping to 8.1%. They are withdrawing from high-volatility assets and shifting toward safe-haven assets such as gold ETFs, indicating rising demand for defensive positioning. Heightened macroeconomic uncertainty is prompting retail investors to reduce leverage and shift toward medium to long-term strategies, with future trends subject to market volatility impacts.
GateNews22m ago
