World Liberty Financial (WLFI), Cosmos (ATOM), and Jupiter (JUP) all experienced slight recoveries on Wednesday, countering the sell-off wave that has been sweeping across the entire cryptocurrency market. However, the technical outlook for WLFI and ATOM still shows mixed signals, as the short-term rebound continues to face pressure from the prevailing downtrend.
World Liberty Financial Recovers from a Key Support Zone
As of Wednesday, World Liberty Financial (WLFI) is trading around $0.1300, maintaining a gain of approximately 3% compared to the previous session. Nevertheless, the overall technical picture remains risky as the price continues to stay below the 50-day EMA at $0.1552, while the 200-day EMA at $0.1589 acts as a resistance ceiling, sustaining the long-term downtrend.
In this context, any sustainable recovery efforts by WLFI are likely to face strong selling pressure near these moving averages.
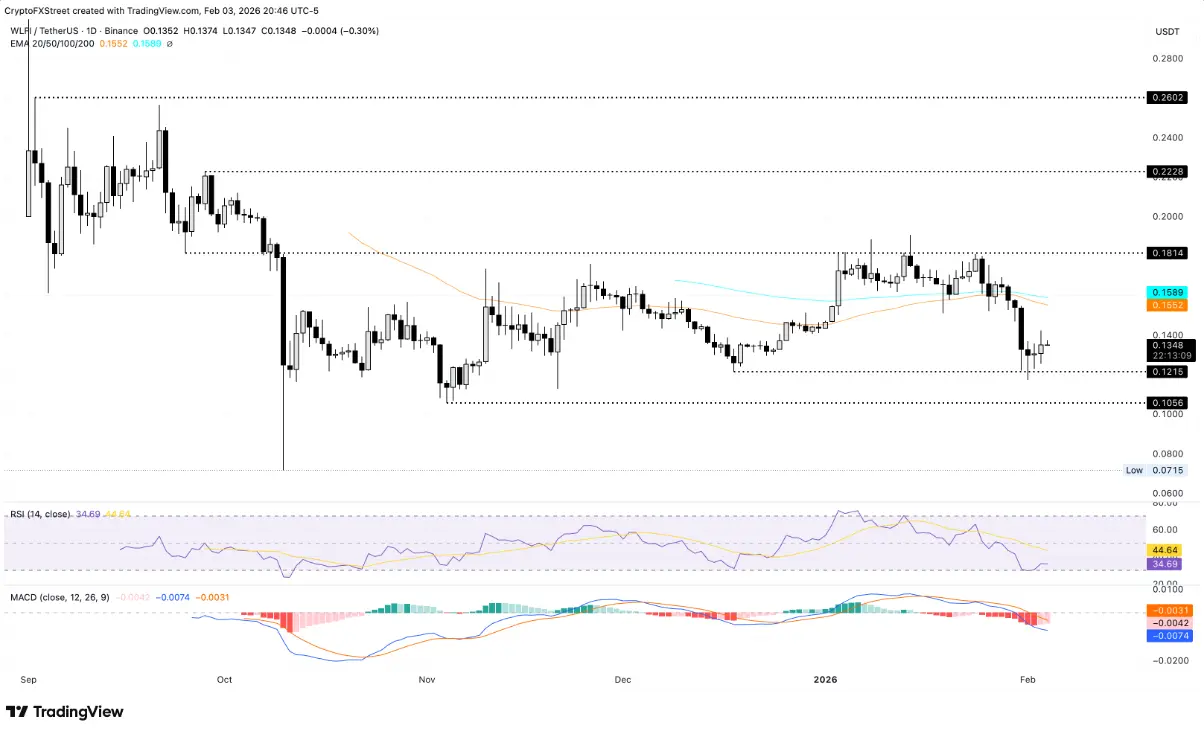 Daily WLFI/USDT Chart | Source: TradingView
On momentum indicators, the MACD and signal line are showing signs of weakening in the bearish trend as the negative histogram narrows, reflecting cooling selling pressure. The RSI is currently at 34, having bounced off the oversold zone but still below the neutral 50 level, indicating that buying demand has not yet gained the upper hand.
Conversely, if WLFI loses the critical support zone at $0.1215—corresponding to the low formed on December 18—the price could face the risk of extending its decline toward the S1 Pivot at $0.1062.
Cosmos Extends Its Recovery Above the $2.00 Level
ATOM rose about 2% at the time of writing on Wednesday, marking its third consecutive session of recovery and bringing the total gain to over 8%. However, this upward move is still insufficient to reverse the trend as ATOM continues to trade below the 50, 100, and 200-day EMAs—at $2.283, $2.541, and $3.094 respectively—all pointing downward. The position of the 50-day EMA below the 100-day EMA continues to confirm that the bearish trend remains dominant.
In a positive scenario, if ATOM can close firmly above the 50-day EMA around $2.283, the recovery momentum could extend toward the 100-day EMA at $2.541. On the other hand, failure to break above this level would keep selling pressure intact, with the EMAs acting as significant resistance barriers.
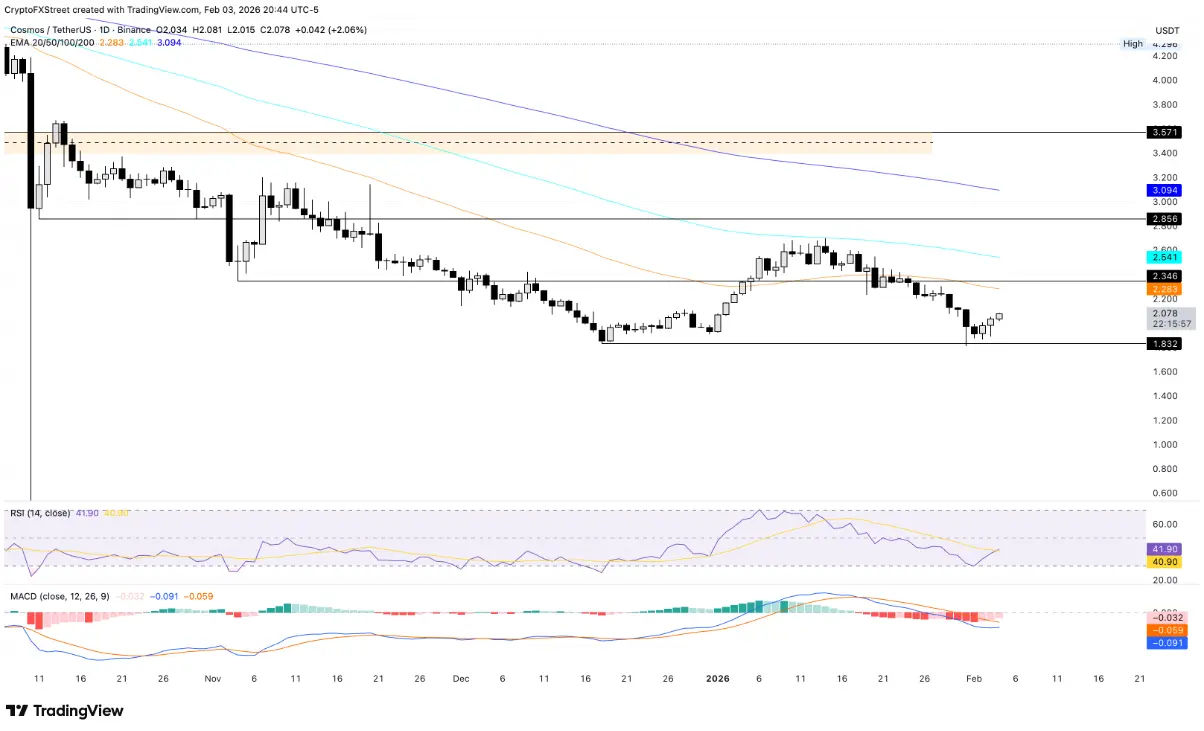 Daily ATOM/USDT Chart | Source: TradingView
Regarding momentum indicators, the MACD remains below the signal line, but the histogram is gradually narrowing toward zero, indicating waning selling pressure. The RSI at 42 reflects a neutral-to-bearish stance, although it is trending upward, suggesting market momentum is stabilizing but not yet strong enough to confirm a clear reversal.
In a negative scenario, ATOM could face the risk of retesting the key support zone at $1.832—matching the December 18 low—if resistance levels above intensify.
Jupiter Strives to Regain Upward Momentum
The JUP token is still trading below the 50-day EMA at $0.2111, which continues to suppress its recovery attempts and maintains a short-term bearish bias. As of Wednesday, JUP has gained nearly 1%, extending its recovery after a 3% increase in the previous session.
In a positive outlook, if JUP can close decisively above the 50-day EMA at $0.1552, selling pressure could ease, paving the way for a technical rebound toward the R1 Pivot resistance at $0.2299. Conversely, continued rejection at this level would increase the risk of a correction and maintain the downward trend.
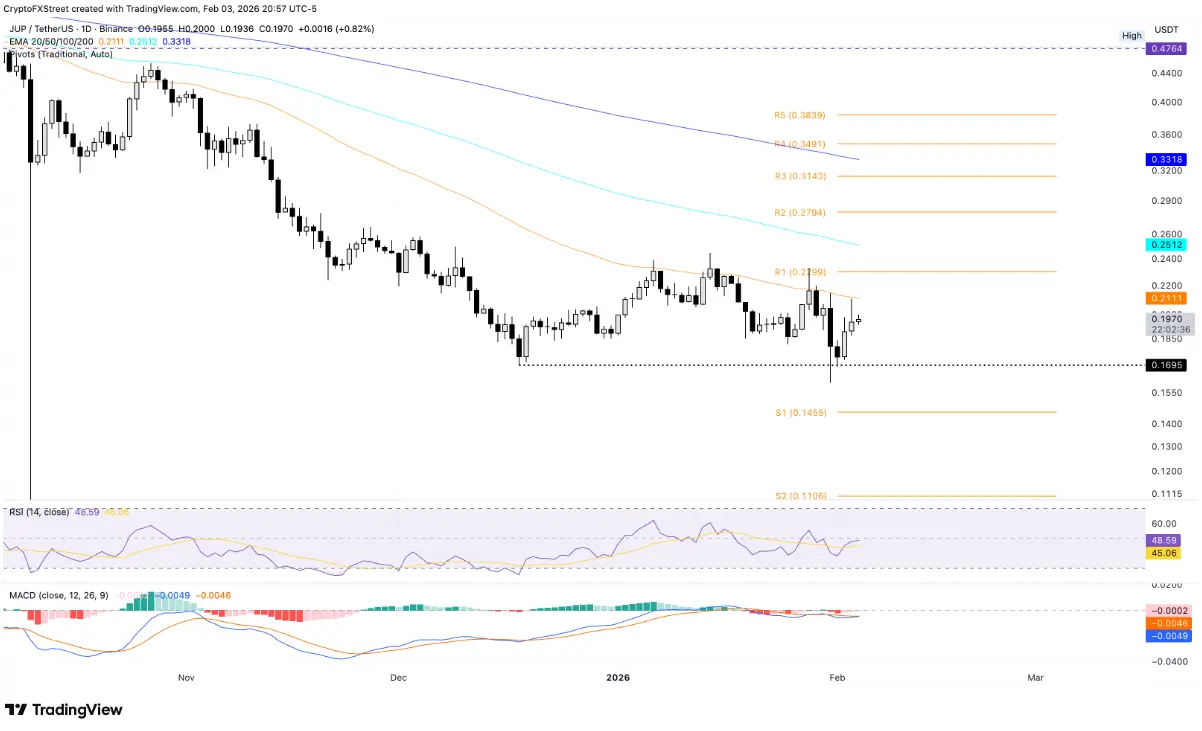 Daily JUP/USDT Chart | Source: TradingView
On momentum, the MACD remains below the signal line around zero, but the negative histogram is shrinking, indicating weakening selling pressure. The RSI at 48 is slightly rising, reflecting a more balanced market condition.
If the price reverses downward, the notable support zone for JUP remains at the December 18 low, around $0.1695.
Disclaimer: The information on this page may come from third parties and does not represent the views or opinions of Gate. The content displayed on this page is for reference only and does not constitute any financial, investment, or legal advice. Gate does not guarantee the accuracy or completeness of the information and shall not be liable for any losses arising from the use of this information. Virtual asset investments carry high risks and are subject to significant price volatility. You may lose all of your invested principal. Please fully understand the relevant risks and make prudent decisions based on your own financial situation and risk tolerance. For details, please refer to
Disclaimer.
Related Articles
Analyst Says Bitcoin Indicators Show Early Signs of Market Recovery
Stablecoin liquidity rose by ~$8B since February, signaling potential improved market trading conditions.
Inter-exchange Flow Pulse turned positive, indicating more Bitcoin moving to derivatives platforms.
Long-term holders retain ~79% of supply, showing gradual supply transfers rather
CryptoFrontNews1h ago
Dogecoin at a Turning Point — Will $0.094 Resistance Finally Break?
Dogecoin was trading between $0.0925 and $0.09173 with the price stabilizing around $0.0925.
The immediate $0.09443 resistance caps the current range. A move above this level could expand today’s trading activity.
Past historical price movements coincide with a number of trend support res
CryptoNewsLand2h ago
XRP Breaks $1.40 Resistance as Volume Surge Lifts Momentum
Key Insights
XRP surged past the $1.40 resistance after trading volume climbed nearly 13%, signaling renewed trader interest and stronger short-term momentum.
Ripple’s collaboration with Mastercard through the Crypto Partner program increased market attention as investors anticipate
CryptoNewsLand2h ago
XRP Price Structure Tightens While Heatmap Highlights $1.30 Liquidity Zone
XRP trades near $1.37 support after a 0.9% daily decline, while the $1.44 level remains the immediate resistance in the current range.
A three-week liquidity heatmap highlights a large order cluster around $1.30, indicating a strong liquidity zone below price.
A three-month Gaussian
CryptoNewsLand3h ago
Internet Computer Price Nears Wedge Breakout — Will Momentum Hold Above $2.54?
Internet Computers continues trading within a falling wedge that has developed since November. Price now approaches the pattern’s upper boundary as volatility tightens.
ICP is trading around the $2.57 mark which is a bit higher than the $2.54 support. In the meantime, the immediate
CryptoNewsLand3h ago
Billionaire Investor Stanley Druckenmiller Bullish on Stablecoin Growth
Billionaire investor Stanley Druckenmiller believes stablecoins will become the backbone of the financial system in 10-15 years, citing their efficiency. However, he views much of the wider crypto market as unnecessary, describing it as “a solution looking for a problem.”
Decrypt3h ago