 Trusted Editorial content, reviewed by leading industry experts and seasoned editors. Ad Disclosure
The price of Bitcoin is nearly 45% away from its all-time high of $126,080, reflecting a worsening market climate over the past few months. One of the indicators that confirmed the emergence of the bear market was the breach of the 365-day moving average to the downside late last year. Using this metric, a prominent crypto researcher has come forward with an evaluation that shows how the current Bitcoin bear market compares to the past ones.
Trusted Editorial content, reviewed by leading industry experts and seasoned editors. Ad Disclosure
The price of Bitcoin is nearly 45% away from its all-time high of $126,080, reflecting a worsening market climate over the past few months. One of the indicators that confirmed the emergence of the bear market was the breach of the 365-day moving average to the downside late last year. Using this metric, a prominent crypto researcher has come forward with an evaluation that shows how the current Bitcoin bear market compares to the past ones.
BTC Price Is 30% Below 365-Day Moving Average
In a new post on the social media platform X, CryptoQuant’s head of research, Julio Moreno, revealed that the current bear market performance compares to the ones seen in Bitcoin’s recent history. The indicator in focus in this analysis is the 365-day simple moving average (SMA) on the BTC price chart.
Related Reading: Tether Scraps $20 Billion Funding Ambitions Due To Investor OppositionMoreno defined the start of the bear market as the moment when the price of Bitcoin crossed below the 365-day SMA. According to the on-chain expert, the premier cryptocurrency is down by 30% so far in the current phase, making it one of the worst bear seasons in recent times.
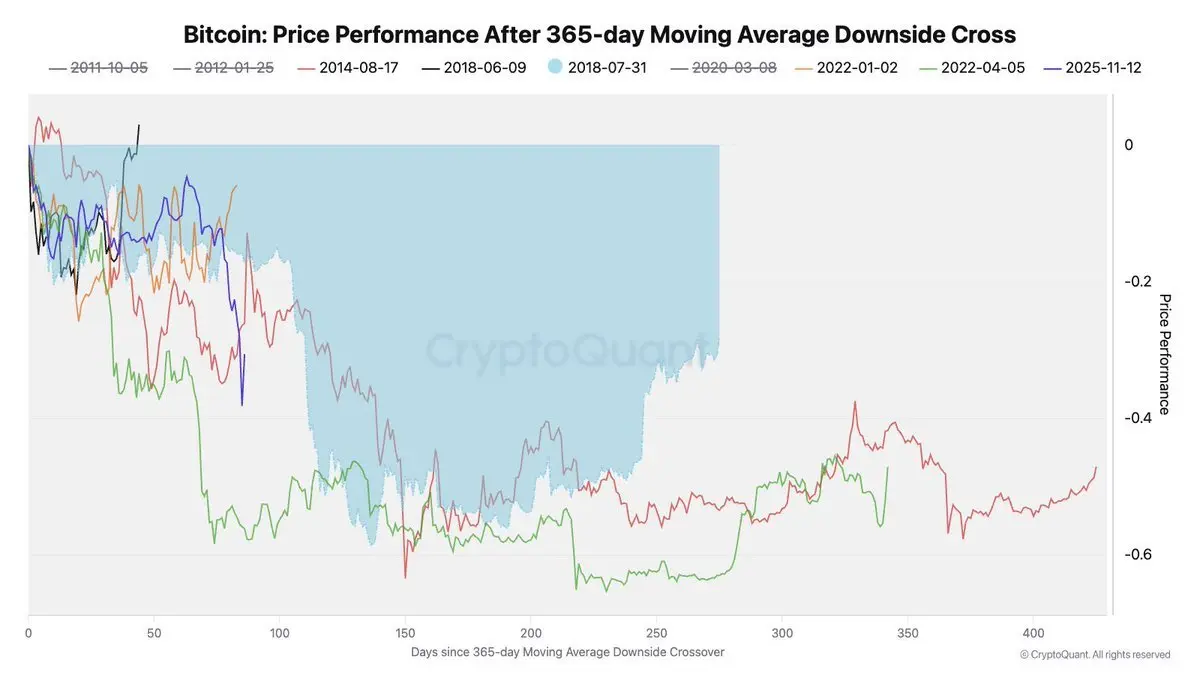
Source: @jjcmoreno on X
As observed in the chart above, the Bitcoin price is deeper than it is often seen at this stage of the bear market. During the 2014 bear market, the flagship cryptocurrency was barely down by 20% at this current stage of the season.
The same could be said for the 2018 bear season, which was more around the 20% market at this stage. However, the price of Bitcoin might have succumbed to greater pressure during the 2022 season, as the market leader was down from its 365-day moving average by nearly 60% at this stage of the cycle.
This trend is especially interesting, considering that Bitcoin is believed to have matured as an asset class. However, the world’s largest cryptocurrency still appears to witness incredible levels of volatility at the beginning of the bear market.
While it is unclear when the Bitcoin price will reach a bottom, certain conditions need to be met for a turnaround to occur. One of these conditions is the apparent demand metric, which has continued to worsen over the past few weeks As seen in the outflow numbers of the US-based Bitcoin ETFs, capital constraints have been a major issue for the premier cryptocurrency.
Bitcoin Price At A Glance
As of this writing, the price of BTC stands at around $70,500, reflecting an over 2% jump in the past 24 hours.
Related Reading: ‘Big Short’ Investor Michael Burry Issues Warning As Bitcoin Crashes Toward $65,000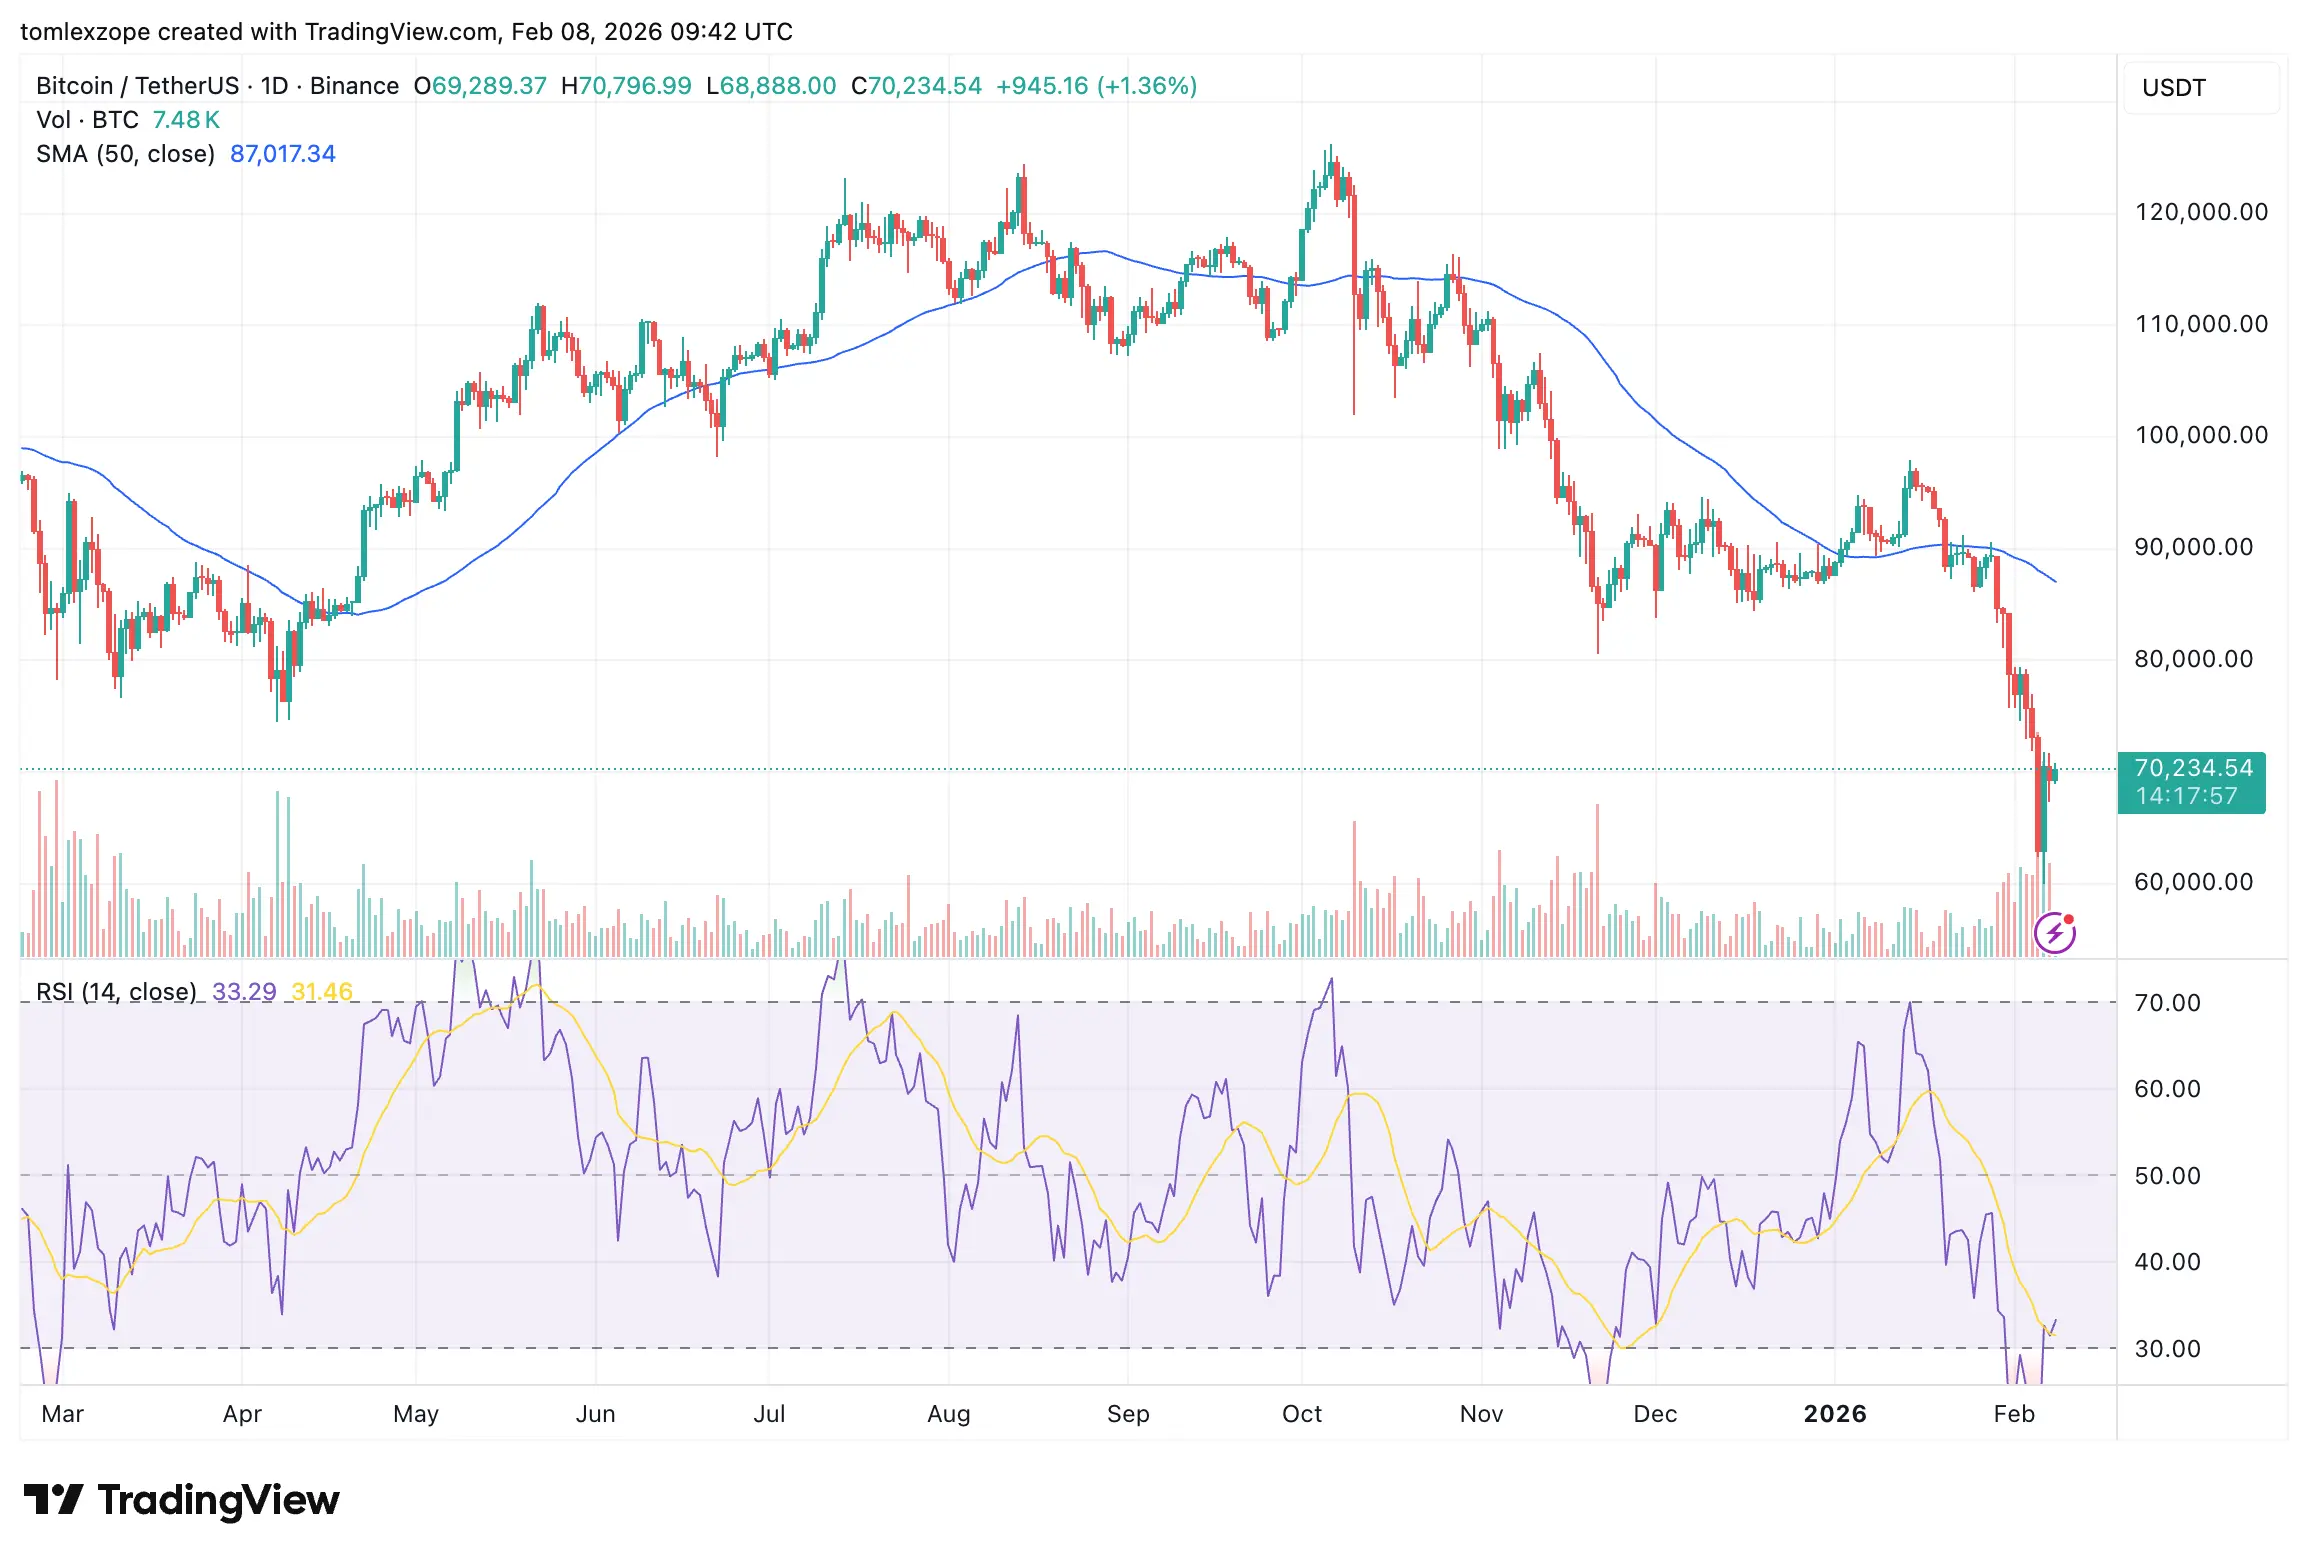
The price of BTC on the daily timeframe | Source: BTCUSDT chart on TradingView
Featured image from iStock, chart from TradingView
![]() Editorial Process for bitcoinist is centered on delivering thoroughly researched, accurate, and unbiased content. We uphold strict sourcing standards, and each page undergoes diligent review by our team of top technology experts and seasoned editors. This process ensures the integrity, relevance, and value of our content for our readers.
Editorial Process for bitcoinist is centered on delivering thoroughly researched, accurate, and unbiased content. We uphold strict sourcing standards, and each page undergoes diligent review by our team of top technology experts and seasoned editors. This process ensures the integrity, relevance, and value of our content for our readers.
Disclaimer: The information on this page may come from third parties and does not represent the views or opinions of Gate. The content displayed on this page is for reference only and does not constitute any financial, investment, or legal advice. Gate does not guarantee the accuracy or completeness of the information and shall not be liable for any losses arising from the use of this information. Virtual asset investments carry high risks and are subject to significant price volatility. You may lose all of your invested principal. Please fully understand the relevant risks and make prudent decisions based on your own financial situation and risk tolerance. For details, please refer to
Disclaimer.
Related Articles
BTC Holds 71K, Morgan Stanley Rushes to Launch ETF, CLARITY Act Key Breakthrough: Today's Crypto Morning Report
March 26, 2026, Bitcoin (BTC) stabilized on $71,000 support, Ethereum (ETH) reported at $2,165, both showing continuous positive returns over the past 30 days. The U.S. CLARITY Act stablecoin compromise plan is progressing, with regulatory policies set to impact the DeFi ecosystem. The SEC announced Bitcoin and Ethereum as commodities, ushering in a new ETF era. DeFi platform Balancer announced closure due to a vulnerability, sparking discussions on governance structures. In the global macroeconomic environment, the Federal Reserve maintained interest rates unchanged amid rising oil prices, facing challenges in rate cuts.
ChainNewsAbmedia12m ago
Bitcoin under pressure as yields rise, Iran conflict, inflation risk
A risk-off mood swept across crypto and traditional markets as geopolitical tensions and stubborn inflation kept investors cautious. Bitcoin tested the $67,500 support level on Monday as traders paused after a run higher, while gold endured a sharp pullback described as one of its steepest
CryptoBreaking37m ago
Strategy Elevates Bitcoin Security as Massive 762K BTC Holdings Raise Market Stakes
Strategy Inc. is escalating its bitcoin risk posture with a new security leadership role and coordinated global program, signaling deeper institutional commitment to protecting massive crypto reserves and strengthening network resilience.
Strategy Expands Bitcoin Security Leadership and Global
Coinpedia40m ago
Technical Analysis March 26: BTC, ETH, BNB, XRP, SOL, DOGE, HYPE, ADA, BCH, LINK
Bitcoin (BTC) is currently trading around 71,342 USD, continuing to encounter strong resistance at the 72,000 USD level. Nevertheless, the bulls are maintaining considerable pressure. Trader Daan Crypto Trades stated on X that BTC needs to break through and hold firmly above this zone to have a chance to "retest the 80,000 USD mark".
The market is inherently dry
TapChiBitcoin1h ago
