
Solana price has entered a quiet phase that often appears after major market declines. Large rallies in previous cycles did not begin during excitement. They started when attention faded and structure slowly rebuilt.
A chart analysis shared by Crypto Patel highlights how the current SOL price movement may be echoing a historical pattern that once preceded dramatic expansion.
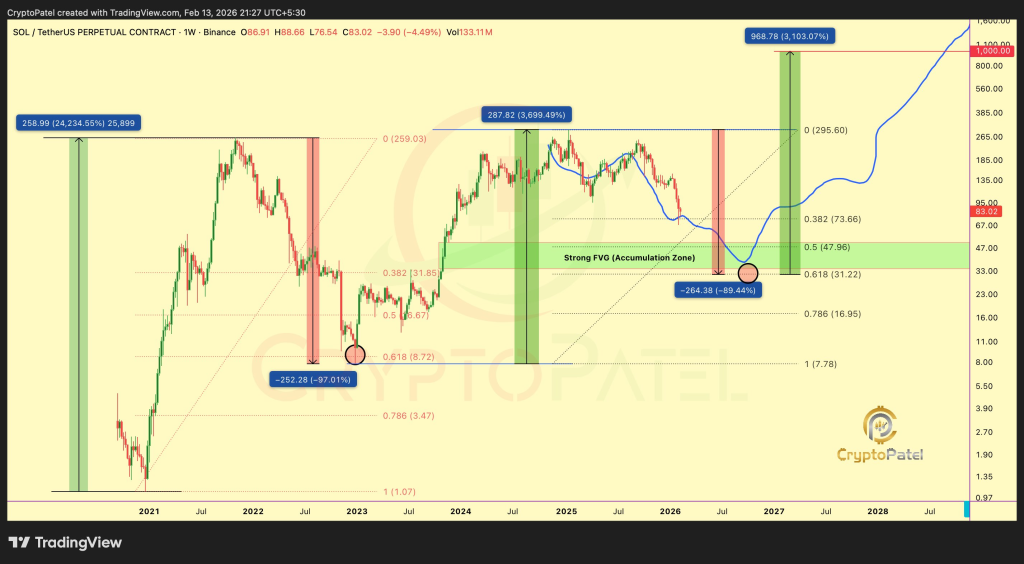
Crypto Patel points to Solana’s first major cycle between 2020 and 2021, where price moved from about $1.07 to nearly $260. That rise represented an extraordinary percentage expansion before a deep correction pulled SOL down close to $7.78.
A second cycle then unfolded between 2022 and 2025, carrying Solana price toward roughly $295 before another large decline began. Present conditions now show SOL trading far below its previous peak after a correction of more than 70%, which creates the foundation for the current fractal comparison.
Solana Price Structure Mirrors Earlier Correction And Accumulation Phases
The attached chart illustrates how each historical rally followed a similar rhythm. Strong upward expansion came first. A sharp retracement then reset the market before accumulation quietly formed near lower Fibonacci levels. Crypto Patel identifies the same type of retracement zone developing again, particularly around the 0.5 to 0.618 Fibonacci region that sits roughly between $30 and $50.
@CryptoPatel / X
This area appears highlighted on the chart as a potential fair value or accumulation region where long term positioning could begin. Previous cycles showed that consolidation inside comparable zones often preceded renewed upward momentum.
Repetition of structure does not guarantee identical outcomes, yet recurring behavior across cycles provides meaningful context for evaluating risk and opportunity.
Price action also shows that volatility tends to compress before major directional movement returns. The current SOL price pattern reflects that compression phase. Market structure therefore becomes more important than short term fluctuations when assessing the broader trajectory.
Long Term SOL Price Path Depends On Support Stability And Historical Fractal Continuation
Crypto Patel outlines possible long horizon targets between $500 and $1,000 if the historical fractal continues to unfold. These projections align with the scale of earlier expansions that followed deep corrections. Movement toward such levels would require sustained support above the identified accumulation zone and gradual rebuilding of trend strength across higher timeframes.
The chart further suggests that deeper retracement remains possible before any confirmed recovery begins. Historical cycles often tested patience through extended consolidation prior to breakout. Stability inside key Fibonacci support therefore remains the central condition to watch.
Gold and Silver Risk Multi-Year Decline as Russia Signals Return to Dollar System_**
Solana now sits at a technically sensitive moment shaped by repetition of past structure and the uncertainty that always surrounds new cycles. Crypto Patel presents the current formation as a reminder that major rallies often grow from quiet foundations rather than immediate excitement.
Disclaimer: The information on this page may come from third parties and does not represent the views or opinions of Gate. The content displayed on this page is for reference only and does not constitute any financial, investment, or legal advice. Gate does not guarantee the accuracy or completeness of the information and shall not be liable for any losses arising from the use of this information. Virtual asset investments carry high risks and are subject to significant price volatility. You may lose all of your invested principal. Please fully understand the relevant risks and make prudent decisions based on your own financial situation and risk tolerance. For details, please refer to
Disclaimer.
Related Articles
OpenClaw Founder Issues Warning: CLAW Fake Airdrop Scams Incoming, GitHub Developers Targeted
OpenClaw founder Peter Steinberger warned users to be vigilant against phishing emails that impersonate GitHub notifications, luring users to click suspicious links to obtain fake tokens. The attack targets developers worldwide, with attackers using publicly available contact information for precision attacks. To prevent fraud, users should only trust information from official websites and delete any suspicious emails.
MarketWhisper3h ago
Bitcoin ETF Inflows for Seven Consecutive Days Set Half-Year Record, Scale Still Below 2025 Peak
US spot Bitcoin ETF sees seven consecutive days of inflows, marking the longest streak since the start of 2025. Cumulative inflows over the past three weeks reached $2.2 billion, accounting for 79% of total crypto inflows. Although market sentiment has improved somewhat, it still falls short compared to the 2025 peak, with analysis suggesting a recovery in market demand rather than the onset of a bull cycle. Solana ETF showed outstanding performance this week, while Ethereum ETF continues to face net outflow pressure.
MarketWhisper3h ago
US SOL Spot ETF Net Outflows of $295,700 Yesterday
According to SoSoValue data, on March 18 Eastern Time, the US SOL spot ETF experienced a net outflow of $295,700 in a single day, all from the VanEck Solana ETF. The total net asset value is currently $884 million, with a cumulative net inflow of $989 million in history.
GateNews5h ago
Best Crypto to Buy Now: BTC, XRP, SOL, TRX, AVAX and APEPEPE Top Picks
Quick Answer: What Is the Best Crypto to Buy Now?
The best crypto to buy now depends on your strategy, but top choices include BTC for market direction, XRP for strength, SOL for growth, TRX for stability, AVAX for rebound potential, and APEPEPE for early-stage upside.
Market Overview: Why
BlockChainReporter8h ago
Solana Price Prediction 2026: How Far Can SOL Go This Year & Why Could DeepSnitch AI 100x Morpho’s Q2 Projection After March Debut?
US-listed Spot Bitcoin exchange-traded funds (ETFs) have attracted almost $1 billion in inflows since March 8, while BTC has surged more than 12% to $74,250 over the same period. This capital flush, which has lasted over six days, marks the longest streak of fresh cash into ETFs since
CaptainAltcoin10h ago
