Bitcoin’s recent weakening is no longer solely explained by bad news or negative sentiment but increasingly reflects the impact of market structure: leverage, cost basis by holder groups, defensive behaviors, and reflexive supply–demand mechanisms. These factors can prolong a downtrend even when selling pressure has decreased in intensity.
According to data from CoinPhoton, BTC is still about 46% below the nearly $126,000 peak set in early October 2025, currently trading around $67,000. Such a deep correction not only results in nominal losses but also transforms the entire behavioral structure of market participants.
On-chain analysis from Glassnode shows this correction occurred following a “multi-step deleverage” pattern. The initial phase was a rapid fall toward the True Market Mean around $79,000—reflecting the average holding cost adjusted for liquidity. This was followed by a sideways absorption phase until the end of January. When this support zone was broken, the market shifted into an accelerated decline, pushing the price close to $60,000. Each stage was accompanied by a change in the dominant selling group.
Notably, the proportion of investors who bought within the last 3–6 months is in a negative equity position. In actual trading, these cost basis zones often form a “hanging supply ceiling.” When the price approaches the breakeven point, demand to exit positions surges to reduce risk, causing the rebound to be quickly broken. This mechanism gives the market a weak recovery impression and a lack of durability.
Data on cost basis ranges by UTXO age from CryptoQuant confirms that BTC prices are below the realized price of short-term holders. This indicates most new capital is in a loss. Not only is this an accounting figure, but it also reduces the market’s “pain tolerance”: short-term investors react faster, locking in losses or exiting positions immediately when a bounce occurs, rather than holding on.
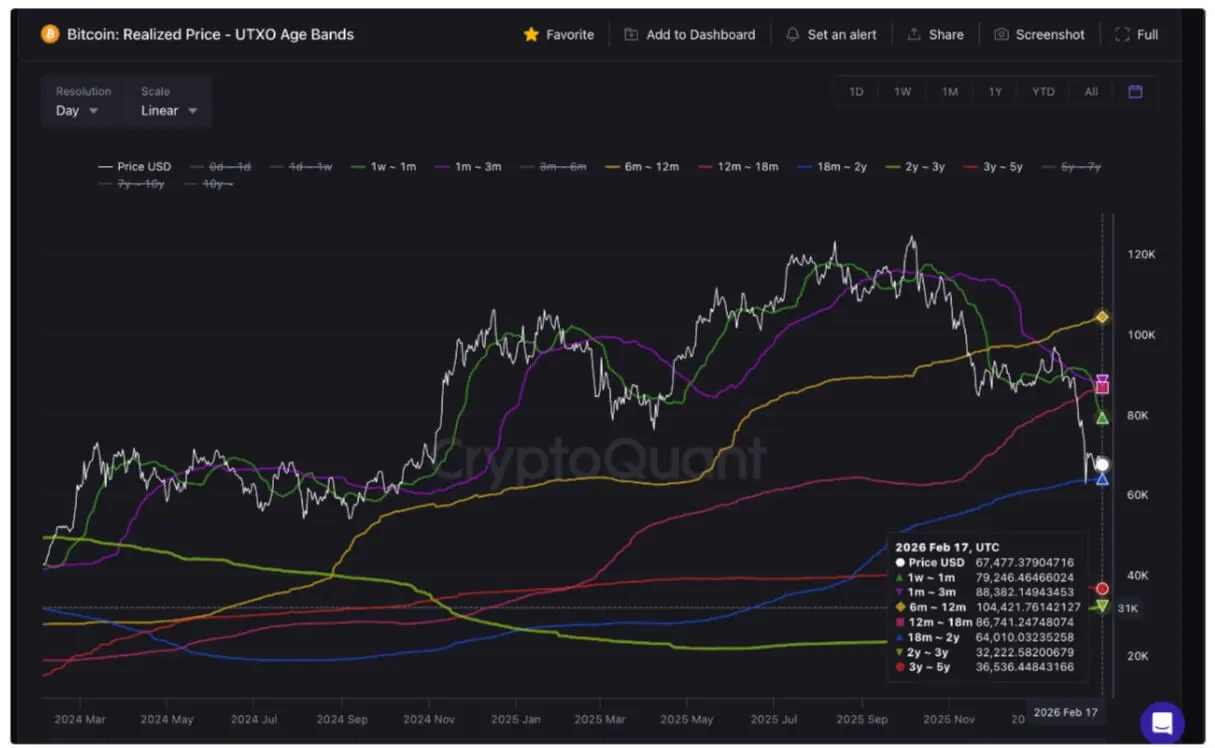 *Actual Bitcoin Price (Source: CryptoQuant)*At the same time, the SOPR indicator for long-term holders—measuring whether coins are spent at a profit or loss—has fallen below 1. This is a significant signal because holdings over 155 days are generally considered a stable supply layer. When long-term SOPR drops below 1, it implies some of the “aged” supply is being sold at a loss, reflecting financial pressure or portfolio reallocation. While not yet a broad capitulation signal, it indicates structural resilience is weakening.
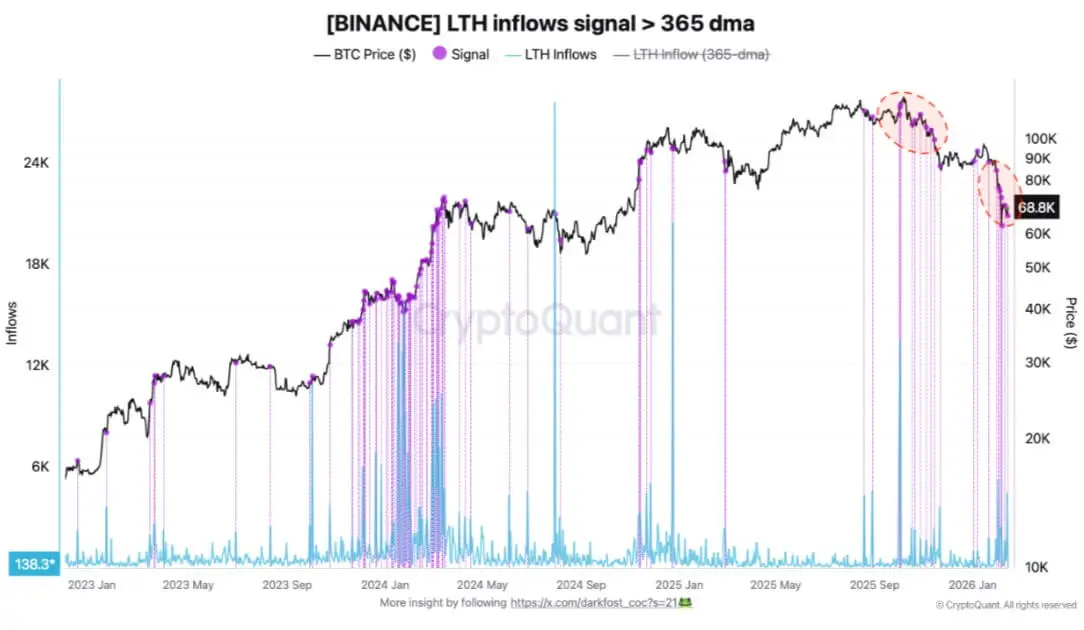
Another behavioral signal is the increasing flow of BTC from long-term holders to Binance. Since Binance has high liquidity depth, large wallets often transfer coins there when ready to sell, hedge, or restructure positions. Increased deposits do not necessarily mean immediate selling but do increase the “put option” premium hanging over the market.
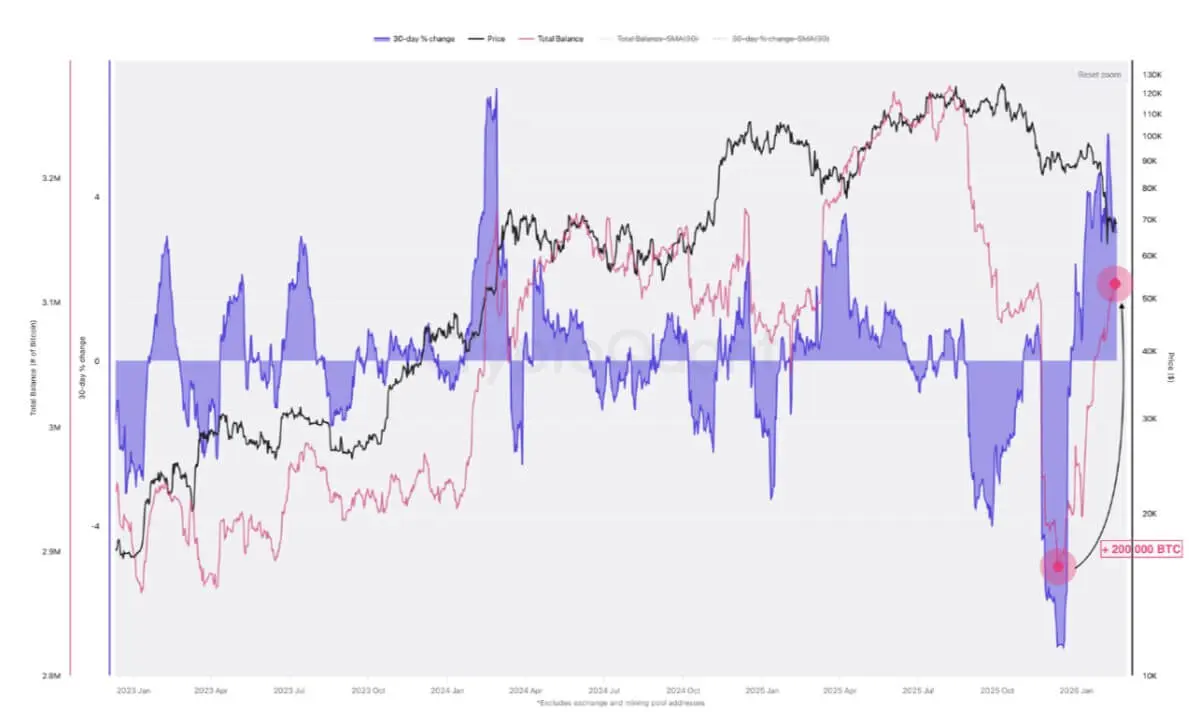
 *Flow of Bitcoin from Long-term Holders to Binance (Source: CryptoQuant)*Conversely, institutional and whale buying activity still exists but is selective. Strategy—previously MicroStrategy—continues to add thousands of BTC, raising total reserves to over 717,000 BTC. This is spot buying, without leverage, helping absorb some supply. Additionally, data shows whale-held BTC has increased by about 200,000 coins in a month, similar to accumulation phases before past strong rebounds.
 *Whale Accumulation of Bitcoin (Source: CryptoQuant)*However, data from Alphractal indicates that short-term holder accumulation momentum is declining rapidly. Although the 90-day net position remains positive, the growth rate has slowed significantly. History shows that when the most “top-timing” group reduces participation, the market often enters a consolidation phase, prolonged accumulation, or trend transition.
Combining these signals, the current structure can be described as follows: above is a thick resistance layer from short-term holder cost basis and hanging supply; below is the market’s structural cost zone. A stable scenario is only reinforced if the price breaks above and sustains above the short-term cost basis, weakening the selling motivation during rebounds. Conversely, if the price continues to be rejected at these levels while long-term holder stress indicators worsen, downward pressure may amplify and extend the correction cycle.
Shach Sanh
Disclaimer: The information on this page may come from third parties and does not represent the views or opinions of Gate. The content displayed on this page is for reference only and does not constitute any financial, investment, or legal advice. Gate does not guarantee the accuracy or completeness of the information and shall not be liable for any losses arising from the use of this information. Virtual asset investments carry high risks and are subject to significant price volatility. You may lose all of your invested principal. Please fully understand the relevant risks and make prudent decisions based on your own financial situation and risk tolerance. For details, please refer to
Disclaimer.
Related Articles
"Seeking a Sword by Marking a Boat" - Style Coin Price Predictions Go Viral: The Practical Logic and Flaws of Mystical Prophecies
Author: Frank, PANews
Whenever the market enters a confusing phase of going nowhere, people try to use a "cutting the boat to seek the sword" method of historical retrospection to predict the next market movement. In such cases, people often see from these theories and charts that history always repeats itself, and seem to automatically overlay and verify future price movements with a certain period in the past.
This coincidence seems to have a magical effect and is often verified. Some bloggers claim this prediction method has an accuracy rate of 75%~80%.
Does this "cutting the boat to seek the sword" style price prediction that repeatedly goes viral on social media help the market identify stages, or is it just packaging noise as prophecy?
From "Tick Fractals" to "History Rhyming"
The peak operation regarding predictions of October 2025 market tops is an analyst named CryptoBullet, who created a method called "ti
区块客5m ago
In the past 24 hours, the entire network liquidated $296 million, with short positions accounting for nearly 80% of the total.
Gate News report: On March 16, according to CoinAnk data, the network liquidated a total of $296 million in the past 24 hours, of which long positions liquidated approximately $63.5177 million and short positions liquidated approximately $233 million. By cryptocurrency: Bitcoin liquidated approximately $101 million, Ethereum liquidated approximately $98.6204 million, SOL liquidated approximately $16.2673 million, and on-chain crude oil synthetic asset XYZ:CL liquidated approximately $7.1913 million.
GateNews5m ago
BTC breaks through 74000 USDT, 24-hour gain of 3.19%
Gate News, on March 16, according to a certain CEX market data, BTC broke through 74000 USDT, currently trading at 74000.1 USDT, with a 24-hour gain of 3.19%.
GateNews9m ago
"Maji Big Brother" opened a long position of 22 BTC with 40x leverage at an entry price of $73,761.
Gate News reports that on March 16, according to Hyperinsight monitoring, "Major Maji" opened a long position of 22 Bitcoin with 40x leverage at an entry price of $73,761. The position is currently showing floating gains of $1,977, up 4.87%, with a total position value of $1,622,478.
GateNews14m ago
