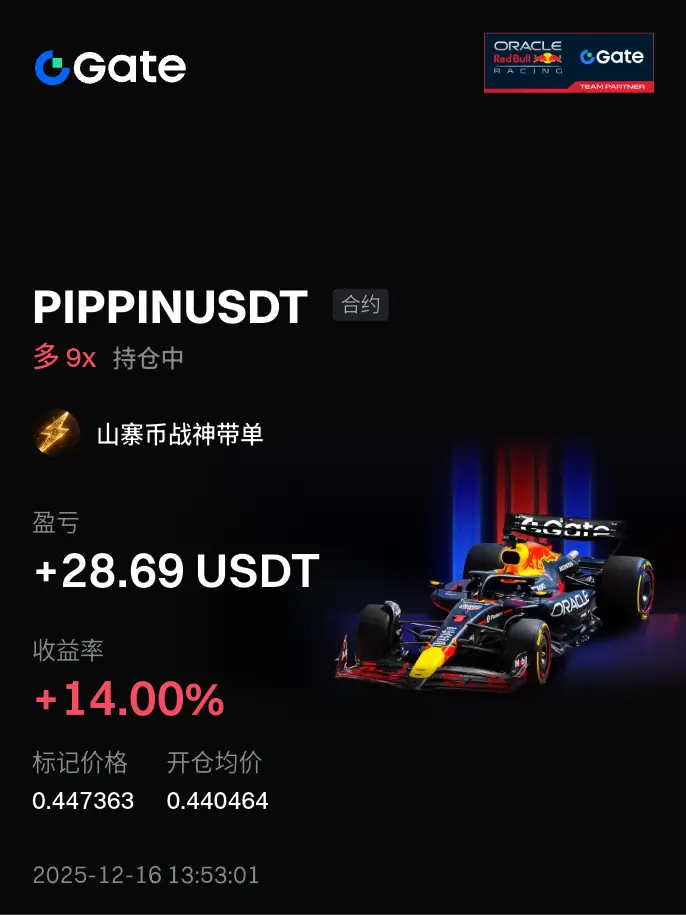
山寨币战神带单
One thought leads to heaven, one thought leads to hell. The sharpest trading in December. #JapanInterestRateHike
$BTC
Crypto market seasonal arbitrage opportunities: short BTC/ETH, go all-in on FIL+ZEC!
By the end of 2025, the crypto market will enter a "polarization" phase—mainstream coins face dual pressure from technical and macro factors, while privacy coins and storage track leaders rise against the trend. Today, we dissect a precise arbitrage strategy: selectively short Bitcoin (BTC), Ethereum (ETH), while going long on Filecoin (FIL) and Zcash (ZEC). Using data and logic, we show you
BTC1.52%
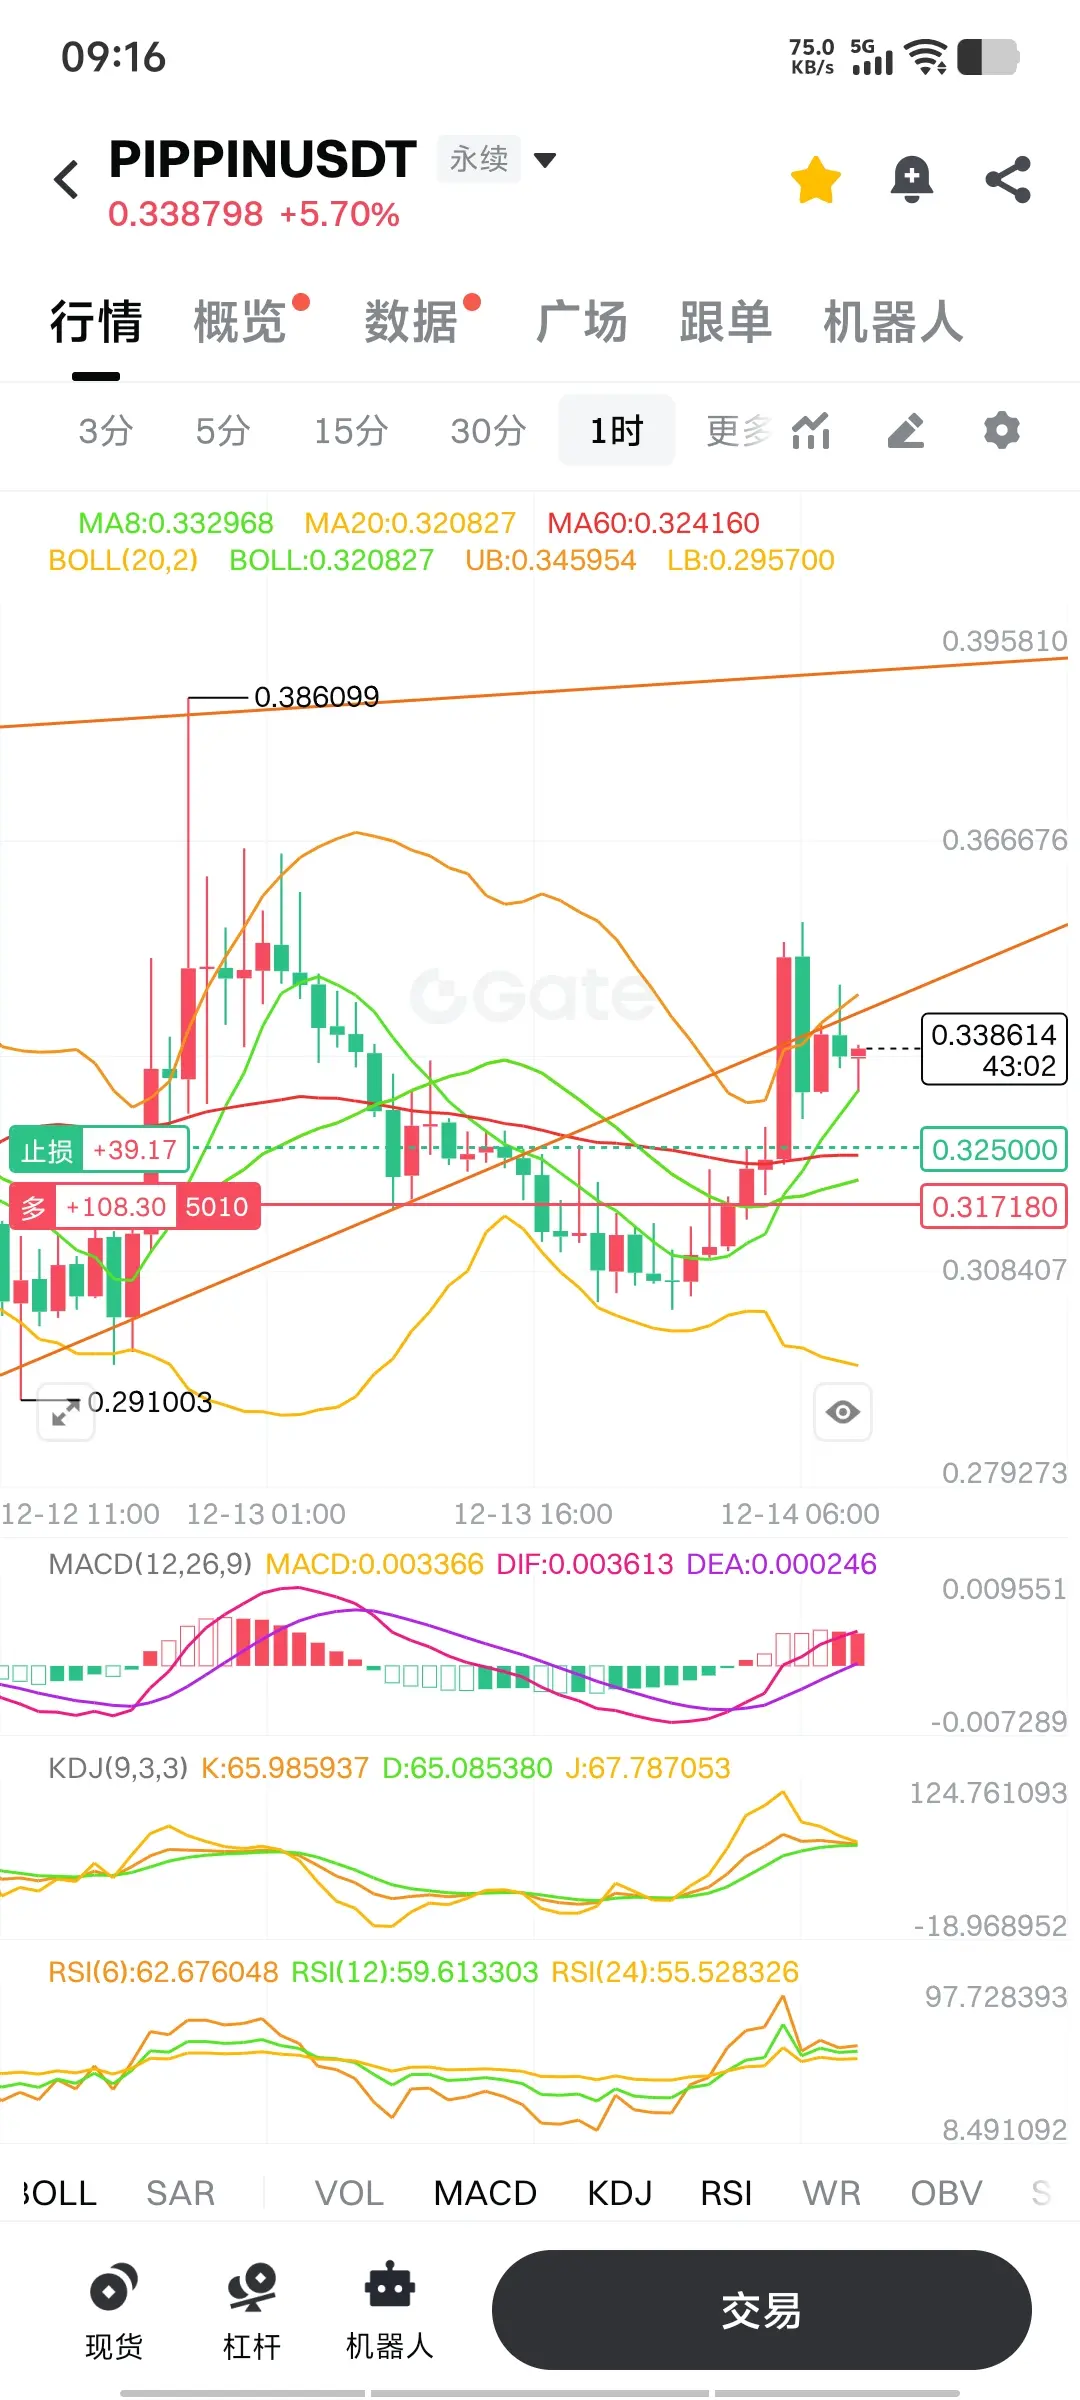
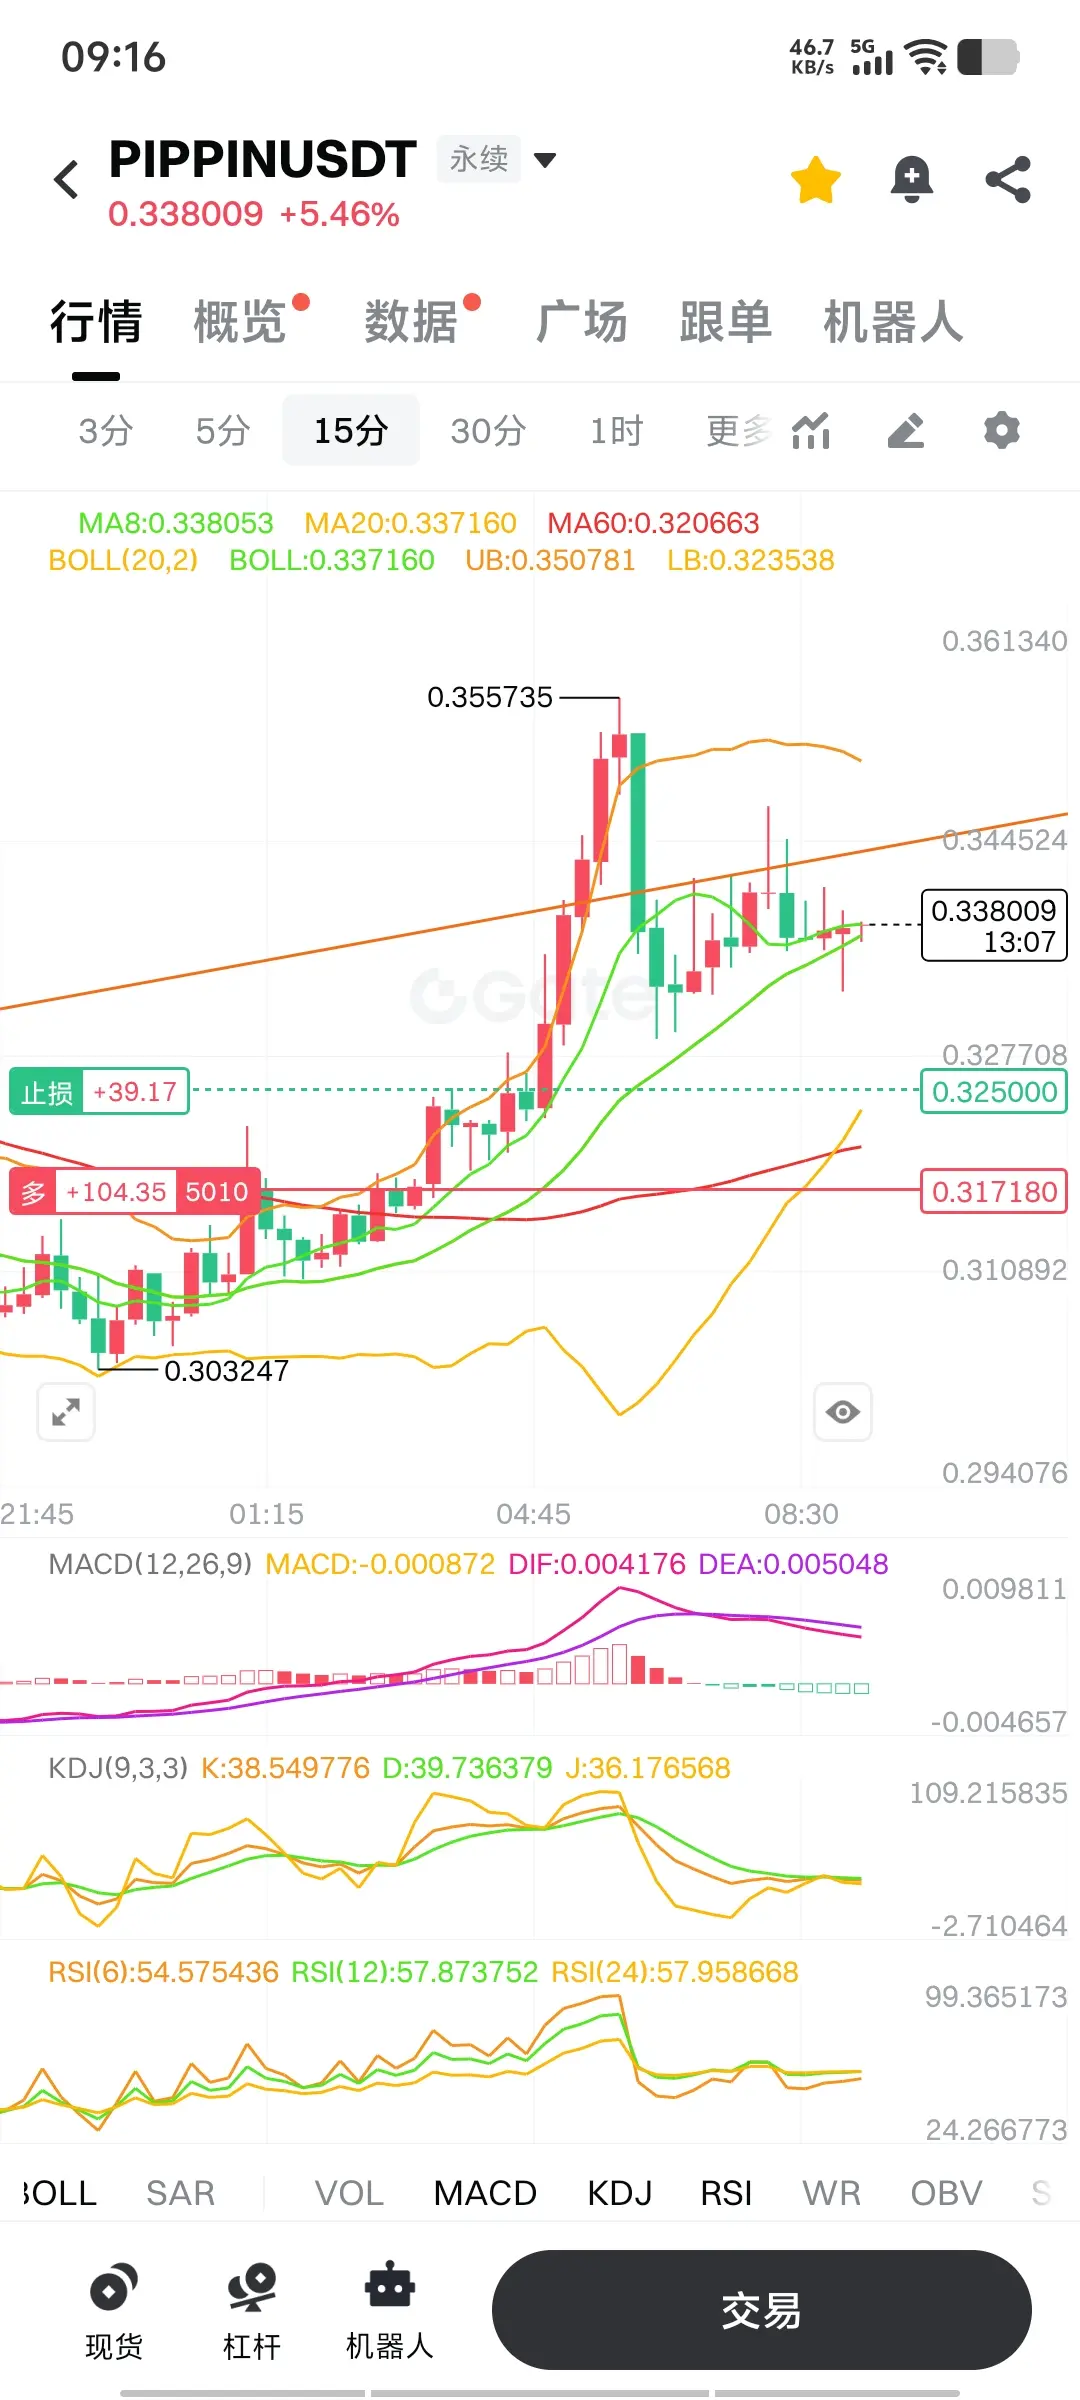
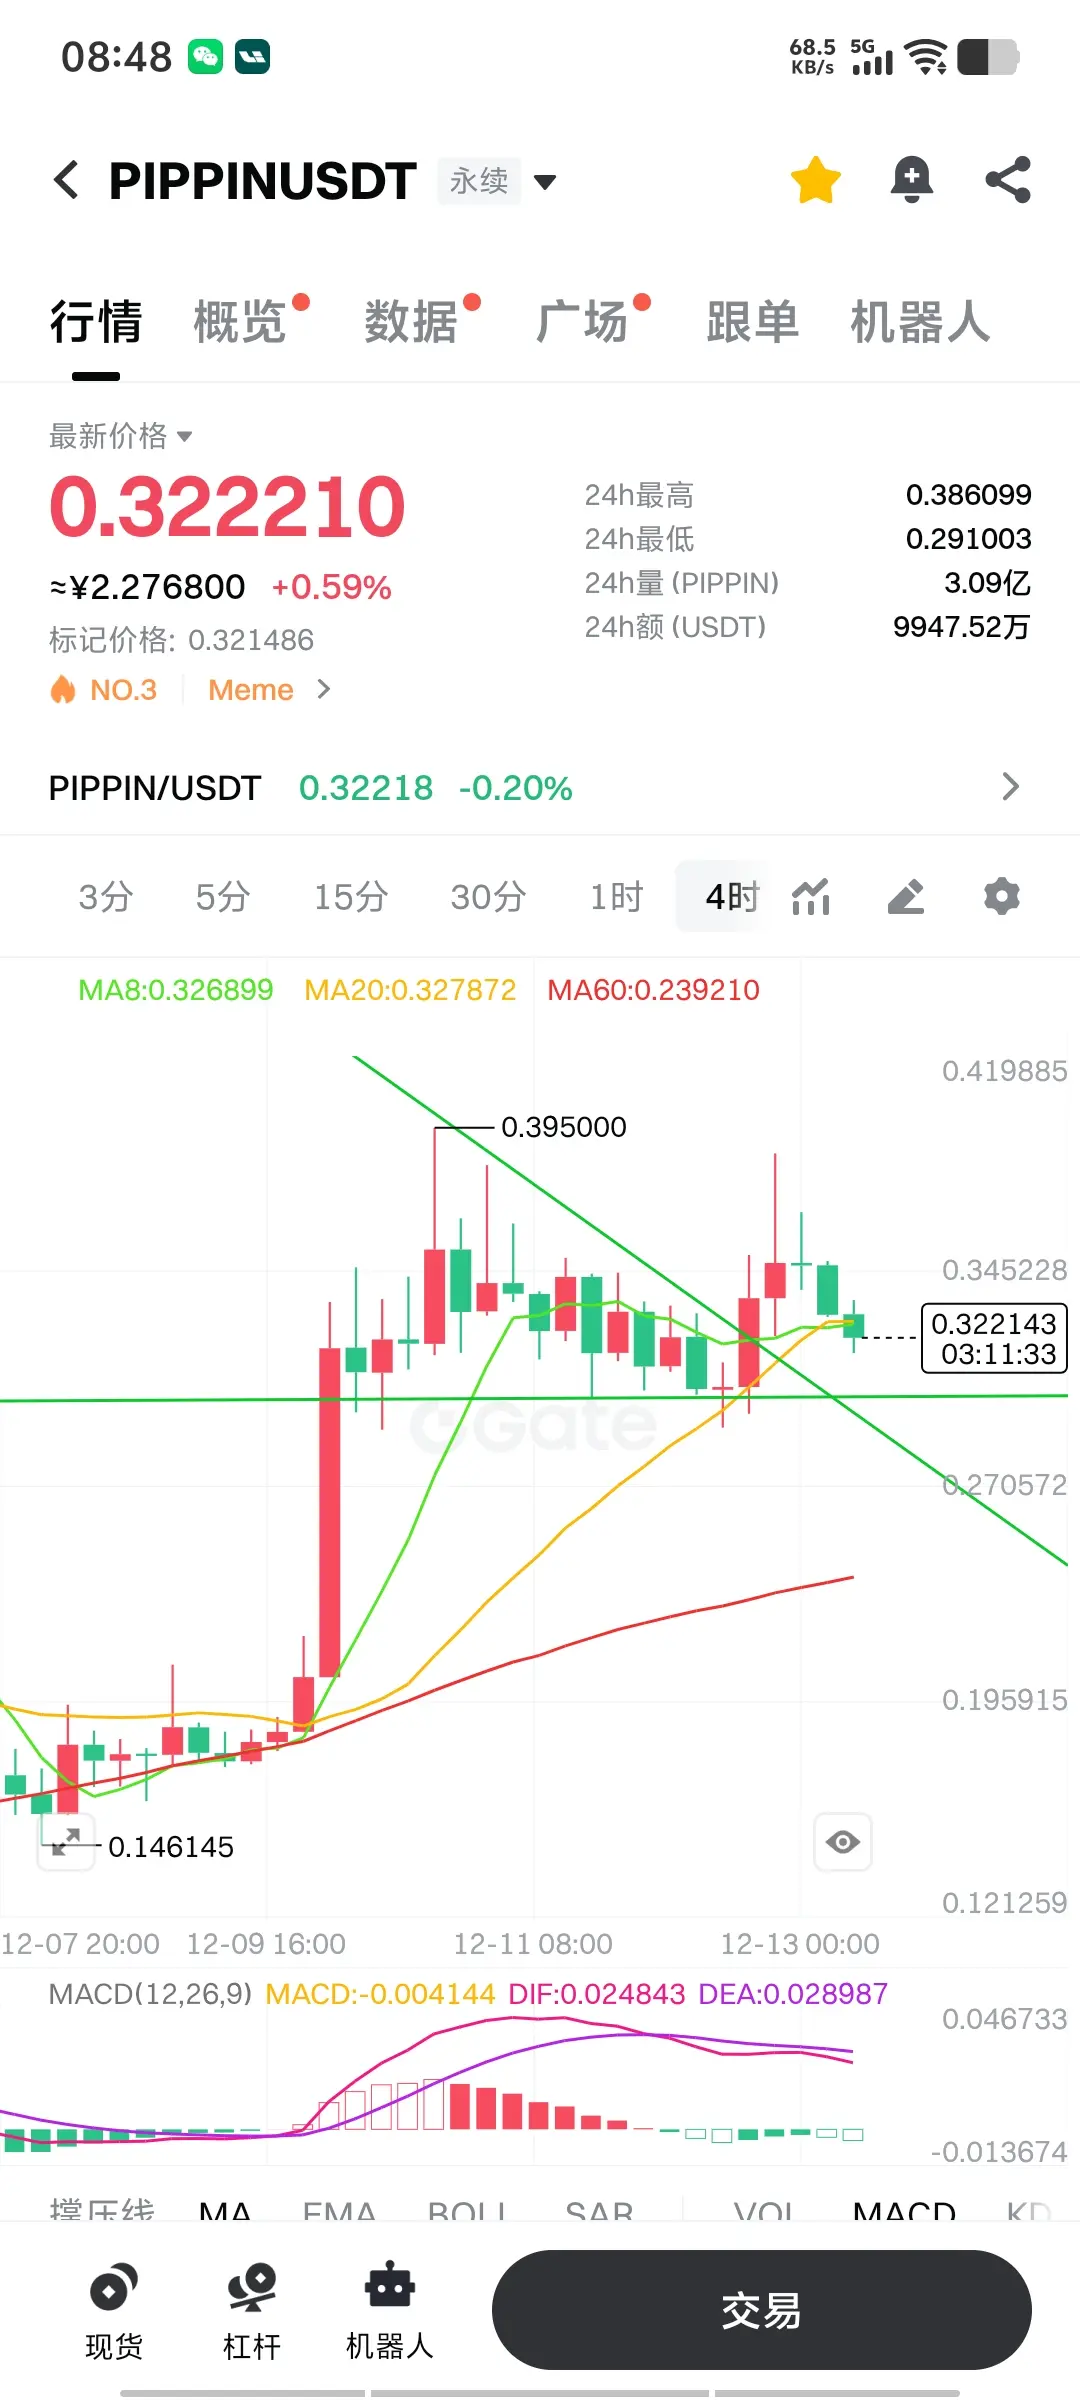
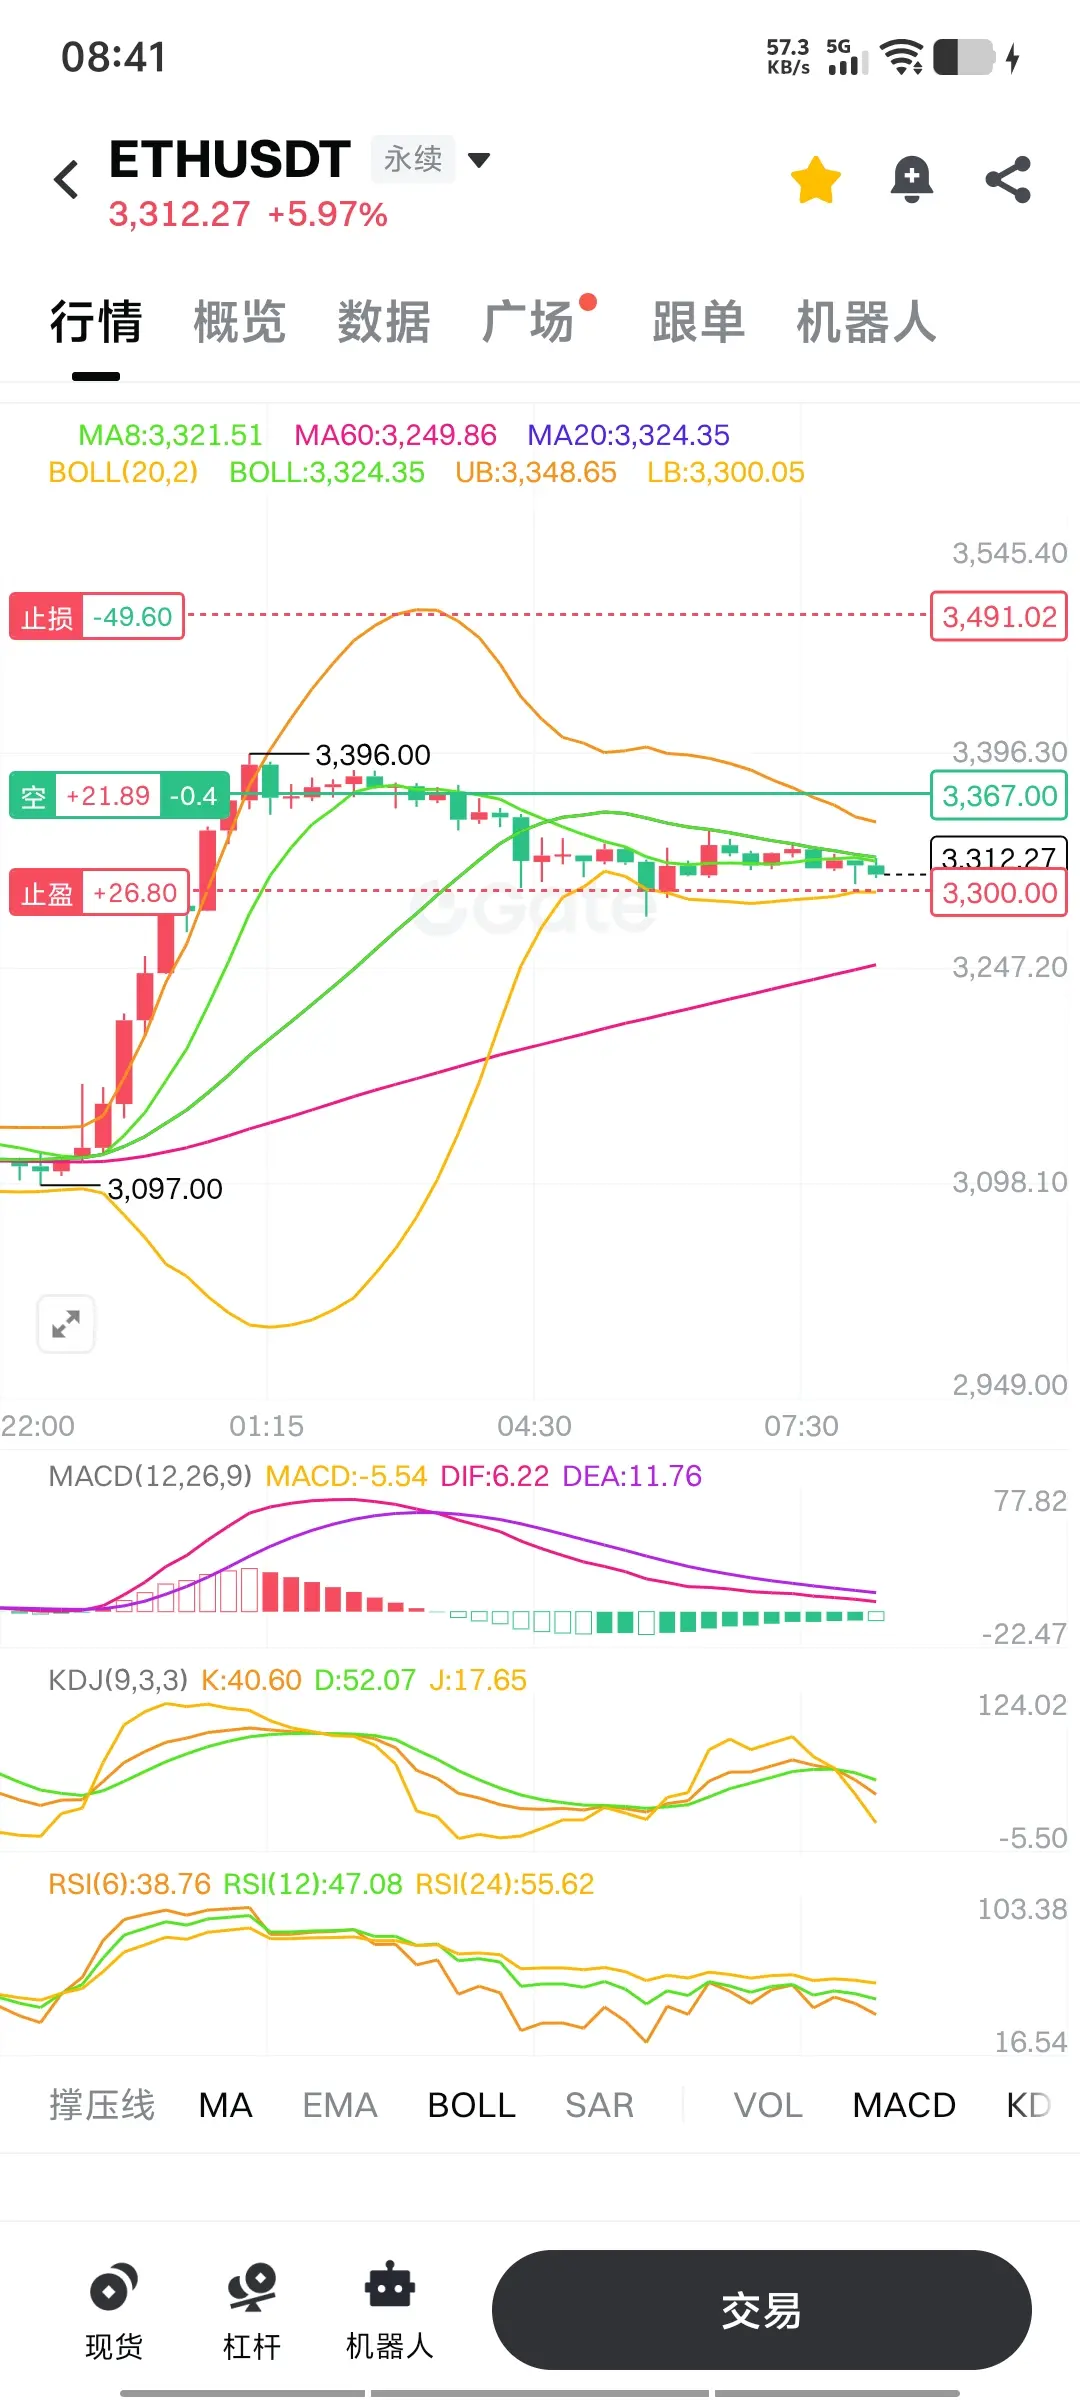
[The user has shared his/her trading data. Go to the App to view more.]