MuxiTrading
vip
Age 0.7 Yıl
Peak Tier 5
No content yet
ETH Direction: Now once again touching the previous low for a rebound, but currently not able to effectively hold above the 1-hour MA5 and MA10.
Resistance levels above: 2966, 3024.
Support levels below: 2820, 2720.
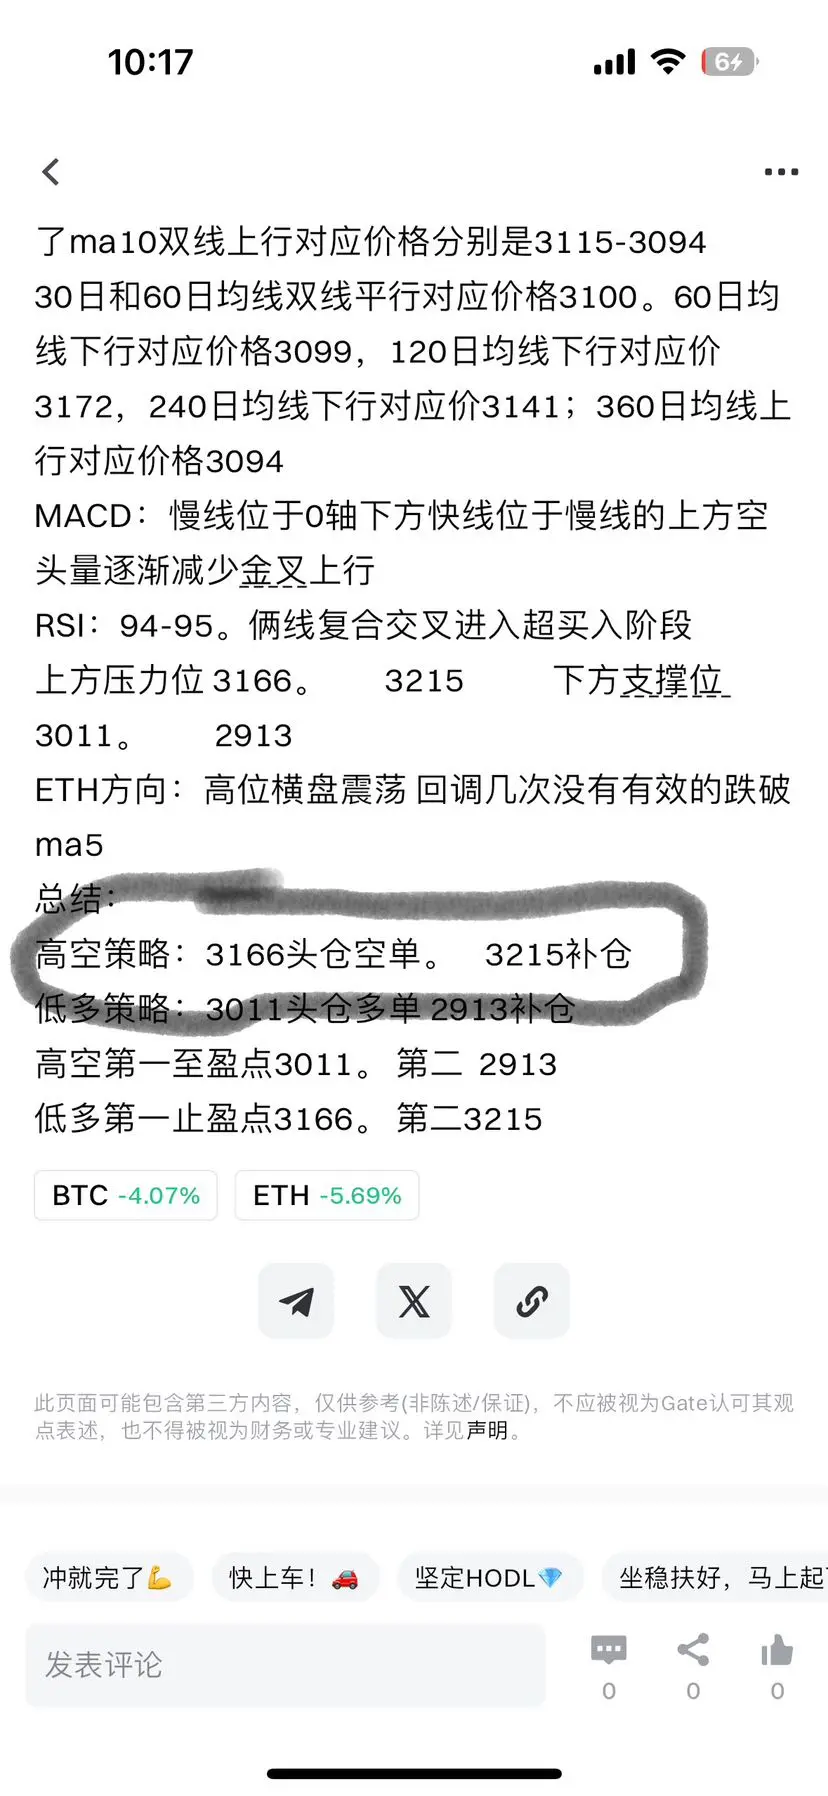
Summary:
High-altitude strategy: Not provided for now.
Long-term buy strategy: Long position at 2820, add to position at 2720.
ETH1.25%
View Original
  • Reward
  • Comment
  • Repost
  • Share
#比特币跌破关键价位
Did you take the short positions at 3166 yesterday?
High short strategy: Head position short at 3017. Add at 3064.
Low long strategy: Head position long at 2916. Add at 2795.
First take-profit point for high shorts: 2916. Second: 2795.
First take-profit point for low longs: 3017. Second: 3064.
ETH 1-hour indicator shows Bollinger Bands opening and closing within the range of 3210-2840. The midline downward trend corresponds to a price of 3024, ETH price at 2941.
Moving average indicator: MA5 and MA10 cross at approximately 2945-2950; 30-day and 60-day moving averages are parallel d
BTC2.57%
ETH1.25%
View Original
post-image
  • Reward
  • Comment
  • Repost
  • Share
#BTC跌破后技术修复 ETH1 Hour Indicator shows Bollinger Bands opening and closing within the range of 3126-3060. The midline parallel to the price at 3093, ETH corresponding price at 3118.
Moving average indicator: ma5 crosses above ma10 from below, indicating an upward trend with prices at 3115-3094. The 30-day and 60-day moving averages are parallel at around 3100. The 60-day moving average is trending downward at 3099, the 120-day at 3172, and the 240-day at 3141; the 360-day moving average is trending upward at 3094.
MACD: The slow line is below the zero axis, the fast line is above the slow line,
BTC2.57%
ETH1.25%
View Original
  • Reward
  • Comment
  • Repost
  • Share
#十二月行情展望 Did you take the long positions around 3023 for ETH yesterday?
ETH direction: Just touched the upper trend line and then pulled back, but the pullback was not very strong. Starting a new trend should require a second wave of upward movement.
Resistance levels above: 3144, 3166. Support levels below: 2983, 2915.
Summary:
High short-term strategy: Not provided for now.
Low long-term strategy: Long position at 2983, add to the position at 2915.
ETH1.25%
View Original
  • Reward
  • Comment
  • Repost
  • Share
#加密市场反弹 ETH 1-hour indicator shows Bollinger Bands opening and contracting within the range of 31138-3062. The lower band corresponds to a price of 3090, and ETH's price is at 3074
Moving average indicators.
The MA5 and MA10 double lines are trending downward at prices of 3080-3070. The 30-day and 60-day moving average cross downward at 3098. The 60-day moving average decline corresponds to 3098, the 120-day moving average decline to 3180, and the 240-day moving average decline to 3142; the 360-day moving average is trending upward at 3092.
MACD: Below the zero line, the fast line is belo
ETH1.25%
View Original
ETH
fall below 3000 second round of fall
14
14
Now no looking back, just charge ahead.
14
14
28 ParticipantsVoting Finished
  • Reward
  • Comment
  • Repost
  • Share
#Gate11月透明度报告出炉 ETH Direction: Currently experiencing a slight upward movement, touching the resistance level at 3130 and then pulling back.
Upper resistance levels: 3145, 3230.
Lower support levels: 3023, 2984.
Summary:
Bullish strategy: Not provided at the moment.
Low buy strategy: Long position at 3023, add to position at 2984.
ETH1.25%
View Original
  • Reward
  • Comment
  • Repost
  • Share
ETH Direction: Currently in a sideways consolidation range at a low level between 3082-3094
Upper resistance levels: 3097, 3113 Lower support levels: 3023, 2984
Summary:
Long-term high-altitude strategy: Not provided for now
Low-position long strategy: 3023 initial long position, 2984 add-on position
ETH1.25%
View Original
post-image
  • Reward
  • Comment
  • Repost
  • Share
ETH 1-hour indicator shows Bollinger Bands opening and closing within the range of 3318-2988. The middle band downward corresponds to a price of 3152, ETH at a price of 3088.
Moving average indicators:
MA5 and MA10 crossover at 3079-3086.
30-day moving average downward at 3179.
60-day moving average downward at 3215.
120-day moving average upward at 3207.
240-day moving average upward at 3150.
360-day moving average upward at 3083.
MACD: Below the zero line, the fast line is below the slow line, indicating decreasing bearish momentum, with a bullish crossover trending upward.
RSI: 29-27, enter
ETH1.25%
View Original
ETH
pump
17
17
fall
14
14
31 ParticipantsVoting Finished
  • Reward
  • Comment
  • Repost
  • Share
#加密市场观察
ETH 1-Hour Indicator shows Bollinger Bands contracting between 3152-3275. The middle band descending corresponds to a price of 3213, and ETH's price is 3257.
Moving average indicators: The MA5 and MA10 double lines are upward, corresponding to prices of 3248-3239. The 30-day moving average crossing downward with the middle band corresponds to 3211. The 60-day moving average turning downward and crossing the upper band corresponds to 3270. The 120-day moving average trending upward corresponds to 3193. The 240-day moving average trending upward corresponds to 3172-3075; the 360-day mov
ETH1.25%
View Original
  • Reward
  • Comment
  • Repost
  • Share
#参与创作者认证计划月领$10,000 ETH Direction: The four-hour chart just touched the four-hour MA30 and then rebounded to rise, currently below the four-hour MA10 and the middle band. The one-hour chart shows the Bollinger Bands are contracting. It just touched the upper band of the Bollinger Bands and then pulled back.
Resistance levels above are 3257 and 3283. Support levels below are 3186 and 3154.
Summary:
High short strategy: Short at 3257, add to short at 3283
Low long strategy: Long at 3186, add to long at 3154
ETH1.25%
View Original
  • Reward
  • 1
  • Repost
  • Share
GateUser-2a9c9a64vip:
You people always talk nonsense.
#美联储降息预测 ETH1-Hour Indicators show Bollinger Bands are narrowing between 3426-3177. The midline is trending downward at 3302, with ETH at 3207.
Moving average indicators: MA5 and MA10 are both trending downward at 3307-3208. The 30-day moving average is declining at 3257. The 60-day moving average is trending upward at 3248, the 120-day at 3160, and the 240-day at 3090; the 360-day is trending upward at 3060.
MACD: Below the zero line, the fast line is below the slow line, indicating a bearish crossover.
RSI: 13-8. Entering oversold territory, both lines are trending upward, indicating a poten
ETH1.25%
View Original
  • Reward
  • Comment
  • Repost
  • Share
#加密市场观察
Based on the 1-hour SOL indicator, the Bollinger Bands are opening, corresponding to the range of 141-130.8. The middle band shows a downward trend, corresponding to a price of 136, and SOL corresponds to a price of 133.5.
Moving average indicators: ma5 has crossed below ma10 from above. The downward movement of ma5 corresponds to a price of 136. ma10 shows a downward trend, corresponding to a price of 137.6. The 30-day moving average is trending upward, corresponding to a price of 135. The 60-day moving average is trending upward, corresponding to a price of 135.5. The 120-day moving
SOL3.08%
View Original
  • Reward
  • Comment
  • Repost
  • Share
#美联储降息预测 ETH 1-hour indicators show the Bollinger Bands narrowing, corresponding to the range of 3448-3015. The middle band is moving upward, corresponding to a price of 3231, and ETH’s corresponding price is 3294.
Moving Averages: MA5 has crossed below MA10 from above, with a downward price of 3308. MA10 is showing a downward trend, corresponding to a price of 3335. The 30-day moving average is rising, corresponding to a price of 3194. The 60-day moving average is rising, corresponding to a price of 3149. The 120-day moving average is rising, corresponding to a price of 3104. The 240-day movi
ETH1.25%
View Original
  • Reward
  • Comment
  • Repost
  • Share
#今日你看涨还是看跌? From the SOL 1-hour indicators, the Bollinger Bands are opening, corresponding range 138.3-130.6. The middle band is moving down, corresponding price 134.4; SOL at 132.
Moving average indicators.
ma5 and ma10 are both trending down and are now above SOL at 132.8-133.1. The 30-day MA is trending up at 134.8. The 60-day MA is trending up at 133.7, the 120-day MA is trending down at 135.2, the 240-day MA is trending down at 135.18; the 360-day MA is flat at 136.3.
MACD: below the 0 line. The fast line is below the slow line, a bearish crossover and falling.
RSI: 15-6. The two lines c
SOL3.08%
View Original
  • Reward
  • Comment
  • Repost
  • Share
#美联储降息预测 ETH 1-hour indicators show the Bollinger Bands opening up with a range of 3163-3092. The middle band is trending upward with a corresponding price of 3127, and ETH's corresponding price is 3104.
Moving averages:
ma5 has crossed below ma10, currently at 3116.
ma10 is rising, corresponding price 3118.
30-day MA is declining, corresponding price 3115.
60-day MA is rising, corresponding price 3082.
120-day MA is declining, corresponding price 3095.
240-day MA is rising, corresponding price 3028.
360-day MA is flat, corresponding price 3008.
MACD: Above the zero line. The slow line is abov
ETH1.25%
View Original
  • Reward
  • Comment
  • Repost
  • Share
#美联储降息预测 SOL 1-hour indicators: The Bollinger Bands are opening with a corresponding range of 139-131. The middle band is descending, corresponding to a price of 135, and SOL's corresponding price is 132.
Moving averages:
MA5 has crossed below MA10, with a corresponding price of 133.4. The 30-day moving average is descending at 134.9. The 60-day moving average is ascending at 133, the 120-day moving average is descending at 135.6, the 240-day moving average is descending at 135, and the 360-day moving average is flat at 136.
MACD: Below the zero line. The fast line is below the slow line in a
SOL3.08%
View Original
  • Reward
  • Comment
  • Repost
  • Share
#比特币活跃度走高 SOL 1-hour indicators: The Bollinger Bands are opening up, corresponding to the range of 137-129. The middle band is trending upward, corresponding to a price of 133, and SOL is corresponding to a price of 135.
Moving Average Indicators:
MA5 has crossed above MA10 from below, corresponding to a price of 134.6. The 30-day moving average is trending downward, corresponding to a price of 133. The 60-day moving average is trending downward, corresponding to a price of 132.8. The 120-day moving average is trending downward, corresponding to a price of 136. The 240-day moving average is tr
BTC2.57%
SOL3.08%
View Original
  • Reward
  • Comment
  • Repost
  • Share
#反弹币种推荐 SOL 1-hour indicators: The Bollinger Bands are opening, corresponding to the range 136.2-129. The middle band is trending downward, corresponding to the price of 132.6, and SOL is at 132.8.
Moving average indicators:
The MA5 has crossed below the MA10 at 132.1. The 30-day moving average is trending downward at 132.6. The 60-day moving average is trending downward at 132.7, the 120-day moving average is trending downward at 137, the 240-day moving average is trending upward at 135.6, and the 360-day moving average is flat at 136.
MACD: Above the 0 axis. The fast line is above the slow l
SOL3.08%
View Original
  • Reward
  • Comment
  • Repost
  • Share
#百倍币种分享 nvSOL 1-hour indicators show the Bollinger Bands opening and closing with a corresponding range of 136.5-130.5. The middle band is trending downward, corresponding to a price of 133.5, with SOL at 133.
Moving average indicators:
The MA10 has crossed above the MA5 from below, corresponding to a price of 133.1. The 30-day moving average is trending downward at 135.18. The 60-day moving average is trending upward at 138.8, the 120-day moving average is trending upward at 136, the 240-day moving average is trending upward at 137.18; the 360-day moving average is flat at 135.3.
MACD: Below
SOL3.08%
View Original
post-image
  • Reward
  • Comment
  • Repost
  • Share
#十二月行情展望 ETH 1-hour indicators: Bollinger Bands are opening downward, corresponding to the range 3190-2963. The middle band is moving down, corresponding to a price of 3077, and ETH is at 3021.
Moving averages:
ma5 and ma10 are about to cross at 3022.
ma10 is moving up, corresponding to 3154. The 30-day moving average is starting to turn downward at 3102. The 60-day moving average is turning downward at 3133, the 120-day moving average is turning upward at 3012, the 240-day moving average is moving up at 3010, and the 360-day moving average is flat at 2947.
MACD: Below the 0 axis. Bearish mome
ETH1.25%
View Original
  • Reward
  • Comment
  • Repost
  • Share
  • Trending TopicsView More
  • Pin
Trade Crypto Anywhere Anytime
qrCode
Scan to download Gate App
Community
  • 简体中文
  • English
  • Tiếng Việt
  • 繁體中文
  • Español
  • Русский
  • Français (Afrique)
  • Português (Portugal)
  • Bahasa Indonesia
  • 日本語
  • بالعربية
  • Українська
  • Português (Brasil)