Trade
Basic
Futures
Futures
Hundreds of contracts settled in USDT or BTC
TradFi
Gold
Trade global traditional assets with USDT in one place
Options
Hot
Trade European-style vanilla options
Unified Account
Maximize your capital efficiency
Demo Trading
Futures Kickoff
Get prepared for your futures trading
Futures Events
Participate in events to win generous rewards
Demo Trading
Use virtual funds to experience risk-free trading
Earn
Launch
CandyDrop
Collect candies to earn airdrops
Launchpool
Quick staking, earn potential new tokens
HODLer Airdrop
Hold GT and get massive airdrops for free
Launchpad
Be early to the next big token project
Alpha Points
Trade on-chain assets and enjoy airdrop rewards!
Futures Points
Earn futures points and claim airdrop rewards
Investment
Simple Earn
Earn interests with idle tokens
Auto-Invest
Auto-invest on a regular basis
Dual Investment
Buy low and sell high to take profits from price fluctuations
Soft Staking
Earn rewards with flexible staking
Crypto Loan
0 Fees
Pledge one crypto to borrow another
Lending Center
One-stop lending hub
VIP Wealth Hub
Customized wealth management empowers your assets growth
Private Wealth Management
Customized asset management to grow your digital assets
Quant Fund
Top asset management team helps you profit without hassle
Staking
Stake cryptos to earn in PoS products
Smart Leverage
New
No forced liquidation before maturity, worry-free leveraged gains
GUSD Minting
Use USDT/USDC to mint GUSD for treasury-level yields
More
READWHAL
No content yet
READWHAL
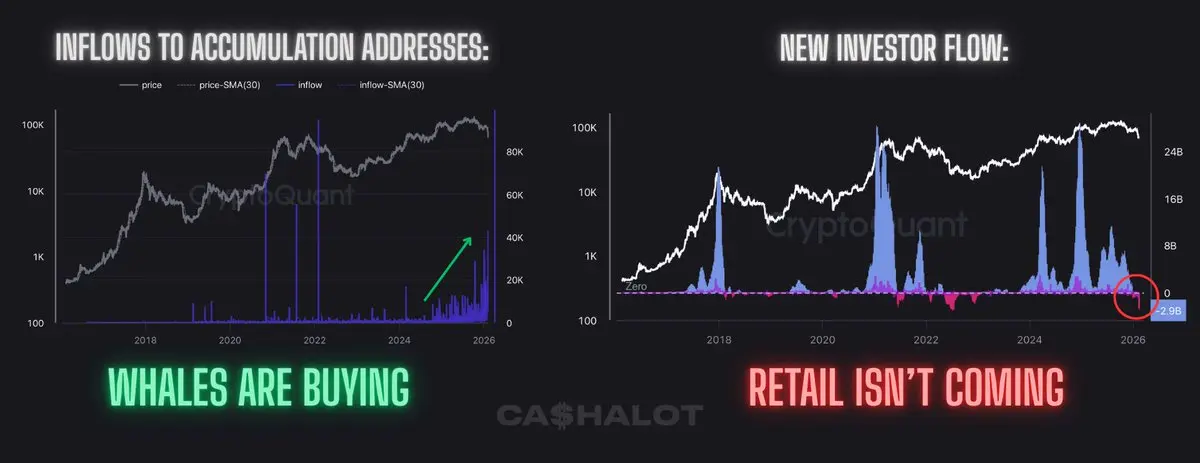
🔗 On-chain data tells a very clear story.
👀 The chart highlights a strong divergence in market participant behavior:
⬅️ On the left - Inflows to Accumulation Addresses: capital flowing into long-term holder wallets. These are experienced players who view market pullbacks as strategic buying opportunities. 🐋
➡️ On the right - New Investor Flow: activity from new market participants, which is currently close to zero.
Historically, retail enters only after price starts accelerating aggressively - driven by FOMO near market tops. The result is usually the same: buying high and exiting in frustr
BTC3,71%
- Reward
- like
- Comment
- Repost
- Share
Today I took locker #68. But I promise that in the coming months we'll move to #100. 📈
While the market is sluggish and nothing is happening, don’t forget about your health. Keep yourself in shape, let off steam so you don’t hold negative thoughts inside, and just stay strong. 👊
While the market is sluggish and nothing is happening, don’t forget about your health. Keep yourself in shape, let off steam so you don’t hold negative thoughts inside, and just stay strong. 👊

- Reward
- like
- Comment
- Repost
- Share
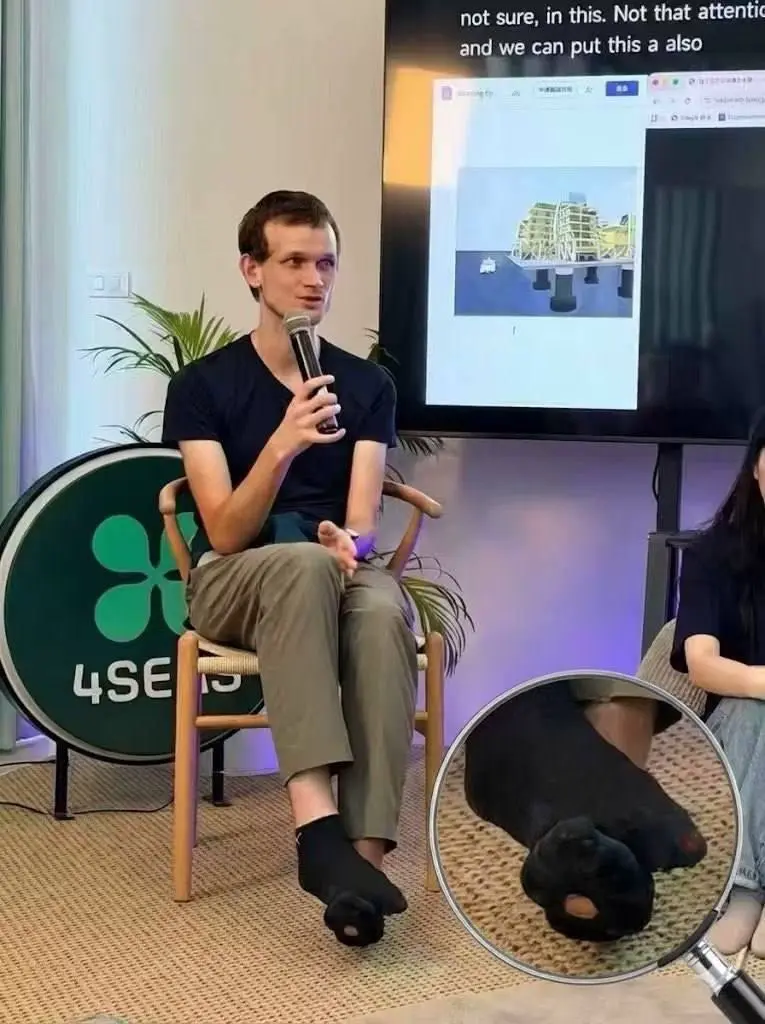
Literally every #Crypto investor now - proud owner of diamond hands, but with socks in liquidation...
- Reward
- like
- Comment
- Repost
- Share
#Bitcoin $BTC is still asleep — so let’s look at the alt leaders. 👀❌ #Solana $SOL broke the downtrend earlier this month but failed to sustain the move, leading to a deeper drop than expected. 📉Price is now back at the trendline and the key $120 level, with RSI oversold + Triple Bullish Divergence.A second wave may be closer than it looks. 🌊
- Reward
- like
- Comment
- Repost
- Share
I almost never go to the “For You” tab, but today it pulled me in. 😂
😉 Remember one thing — if every clown is posting the same chart along with their buddies and saying “this time is not different”, then something that has never happened before is exactly what’s happening.
I recently wrote that in this cycle literally nothing they “predicted” lined up, so this time the drop also won’t happen. 📈🚀
#Bitcoin #BTC $BTC
BTC3,71%
- Reward
- like
- Comment
- Repost
- Share
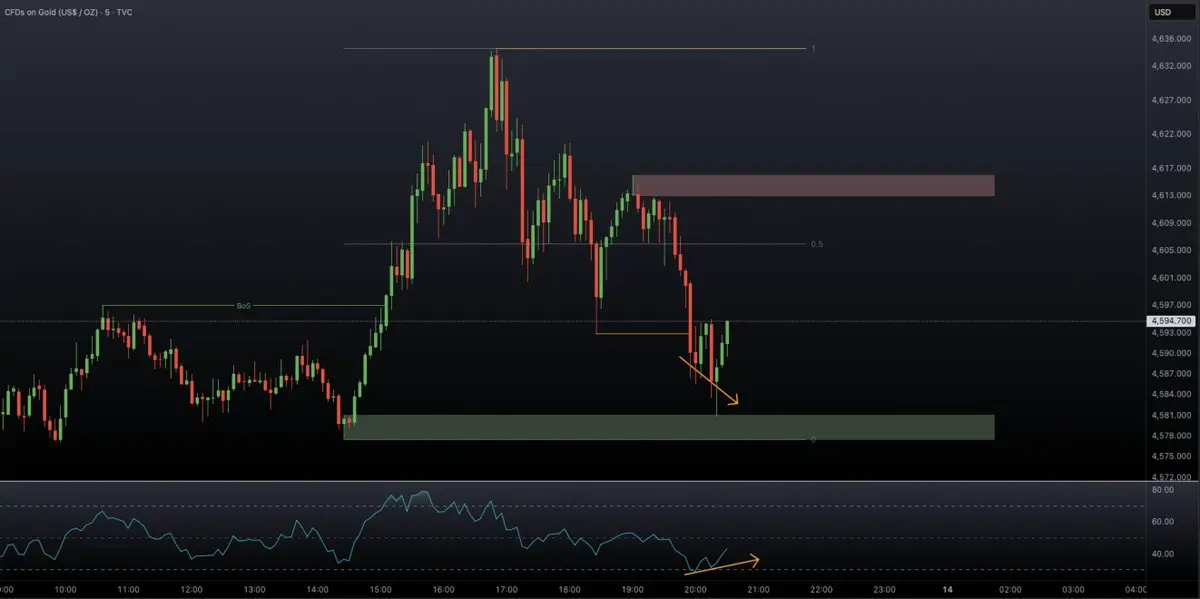
$XAU:
- Bullish OB
- Bullish Divergence on RSI
- Discount Zone after BoS
Send it back turbo.
- Bullish OB
- Bullish Divergence on RSI
- Discount Zone after BoS
Send it back turbo.
- Reward
- like
- Comment
- Repost
- Share

📈 Even though I’m convinced we’ll see a strong bounce in the near future, I wouldn’t be surprised to see $ETH below $3k and $BTC around $80k this month.
〰️ We are in a Wyckoff accumulation phase, and so far everything aligns with that structure. There are also massive liquidity pools below the lows, which whales are likely to target before pushing the market higher. 🐋
I’m not trying to scare anyone, but I want you to be prepared. I’m already in a short, and it’s printing 💸💸
- Reward
- like
- Comment
- Repost
- Share
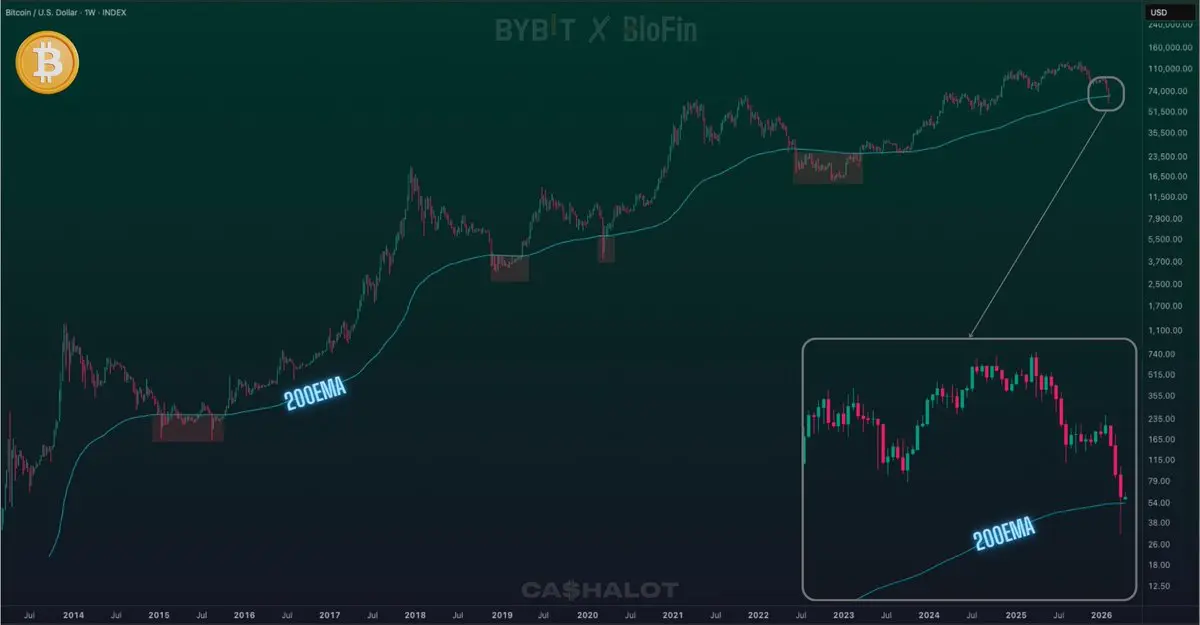
✅ First MACD Golden Cross and an RSI Breakout since May 2020!
📉 This has been the longest downtrend of #Altcoins against #Bitcoin $BTC in history.
Moreover, in the summer of 2025, we saw an all-time record for the lowest RSI ever. 🫣
And now, after 5.5 years, today we are witnessing another sign of a potential shift in the #Crypto. 🔄
📉 This has been the longest downtrend of #Altcoins against #Bitcoin $BTC in history.
Moreover, in the summer of 2025, we saw an all-time record for the lowest RSI ever. 🫣
And now, after 5.5 years, today we are witnessing another sign of a potential shift in the #Crypto. 🔄
BTC3,71%

- Reward
- like
- Comment
- Repost
- Share
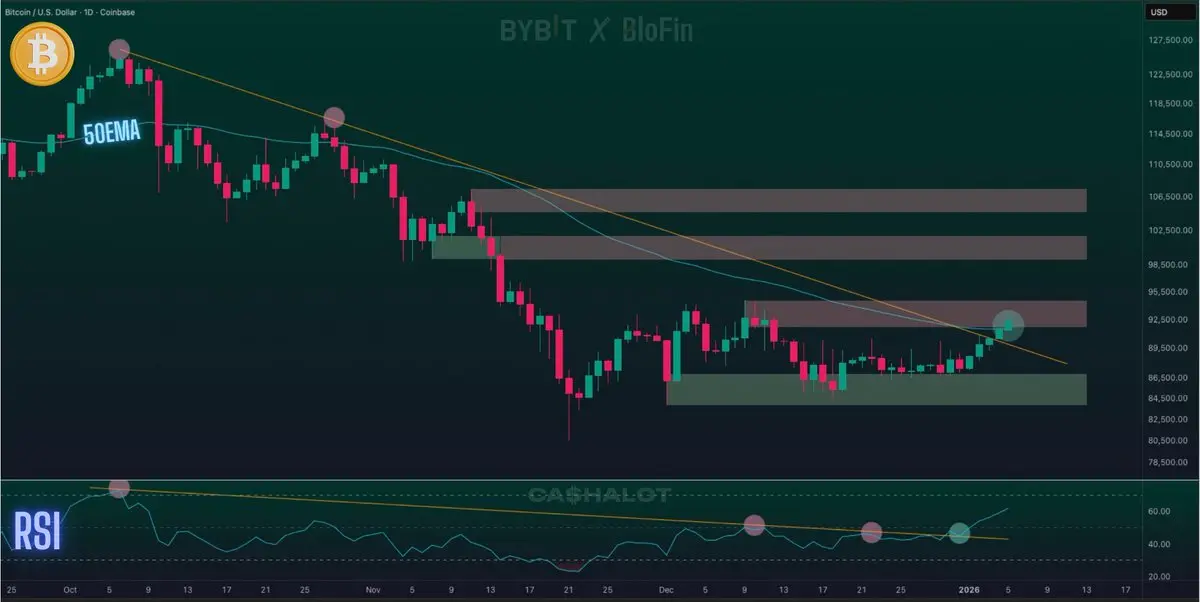
Since the beginning of 2026, this is already the 5th consecutive green Daily candle ! 💪
A strong start to the year, which has resulted in a breakout from a 3-month downtrend. 📉
✅ At this point, we also have a clear breakout on the RSI and a reclaim of the 50 EMA on the Daily.
Before heading into the holidays, I highlighted all of these potential bullish signals - and here is the result. 🚀
#Bitcoin #BTC $BTC
BTC3,71%
- Reward
- like
- Comment
- Repost
- Share
❌ Nothing is over yet !
Happy upcoming New Year to everyone. May 2026 bring you more joy than the outgoing year. 🫡
Wishing you all strong health, diamond hands, steel nerves, love in your homes, and prosperity! 💙
See you in the new year. Much love to everyone 🫶
#Bitcoin #BTC $BTC #Altcoins #Alts $ETH
Happy upcoming New Year to everyone. May 2026 bring you more joy than the outgoing year. 🫡
Wishing you all strong health, diamond hands, steel nerves, love in your homes, and prosperity! 💙
See you in the new year. Much love to everyone 🫶
#Bitcoin #BTC $BTC #Altcoins #Alts $ETH

- Reward
- like
- Comment
- Repost
- Share
2️⃣0️⃣2️⃣5️⃣ turned out to be a tough year for all #crypto investors and enthusiasts.
📉 This year, the crypto market failed to show any meaningful growth, while almost all other asset classes managed to increase in value. That’s why our Christmas tree looks… like this. 💩🎄
🫡 I sincerely wish everyone a Merry Christmas. Spend this holiday with your family and loved ones. Rest, take a breath. I believe we haven’t put the final dot in this cycle yet, so recharge your energy and come back refreshed after the holidays. 🙏
Much love to everyone! 🫶🐋
#Bitcoin #BTC $BTC $SPX #Ethereum #ETH $ETH #

- Reward
- like
- Comment
- Repost
- Share
Trending Topics
View More60.65K Popularity
77.2K Popularity
20.58K Popularity
47.51K Popularity
259.1K Popularity
Pin