Date: Sun, Dec 21 2025 | 08:56 AM GMT
The broader cryptocurrency market has remained under pressure over the past several weeks, following the sharp sell-off that began on October 10. That corrective phase dragged Ethereum (ETH) down by nearly 23% over the last 60 days and weighed heavily on overall market sentiment. While many altcoins have struggled to stabilize, Quant (QNT) has shown relative resilience, posting only a modest decline and holding above a historically important support zone.
From a technical perspective, the daily chart suggests that QNT may be approaching a critical decision point, with price action forming a recognizable structure that could influence its next directional move.
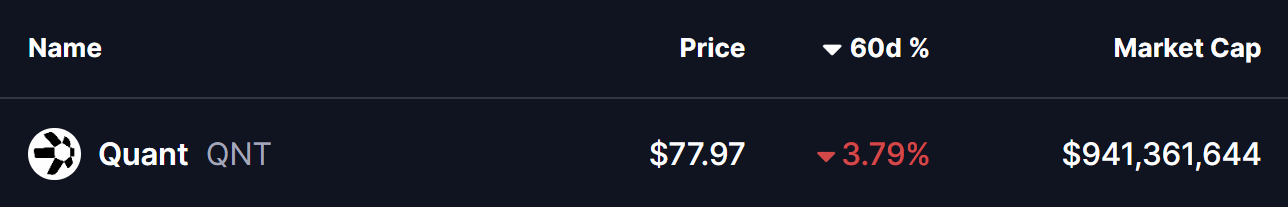
Source: Coinmarketcap
Head and Shoulders Pattern Takes Shape
On the daily timeframe, QNT appears to be carving out a head and shoulders formation, a well-known pattern that often signals a potential trend shift once the neckline is tested. Earlier in the structure, QNT formed the left shoulder before rallying sharply to its head near the $100 region. From there, price reversed lower and slid back toward the neckline, located around the $70 support zone.
This $70 area has proven to be a strong demand zone in the past, repeatedly attracting buyers and preventing deeper declines. The recent move into this region was met with a noticeable reaction, as reflected by the long lower wick on the chart. That rejection from support pushed price back toward the $78 level, suggesting that buyers are actively defending the neckline and potentially forming the right shoulder of the pattern.
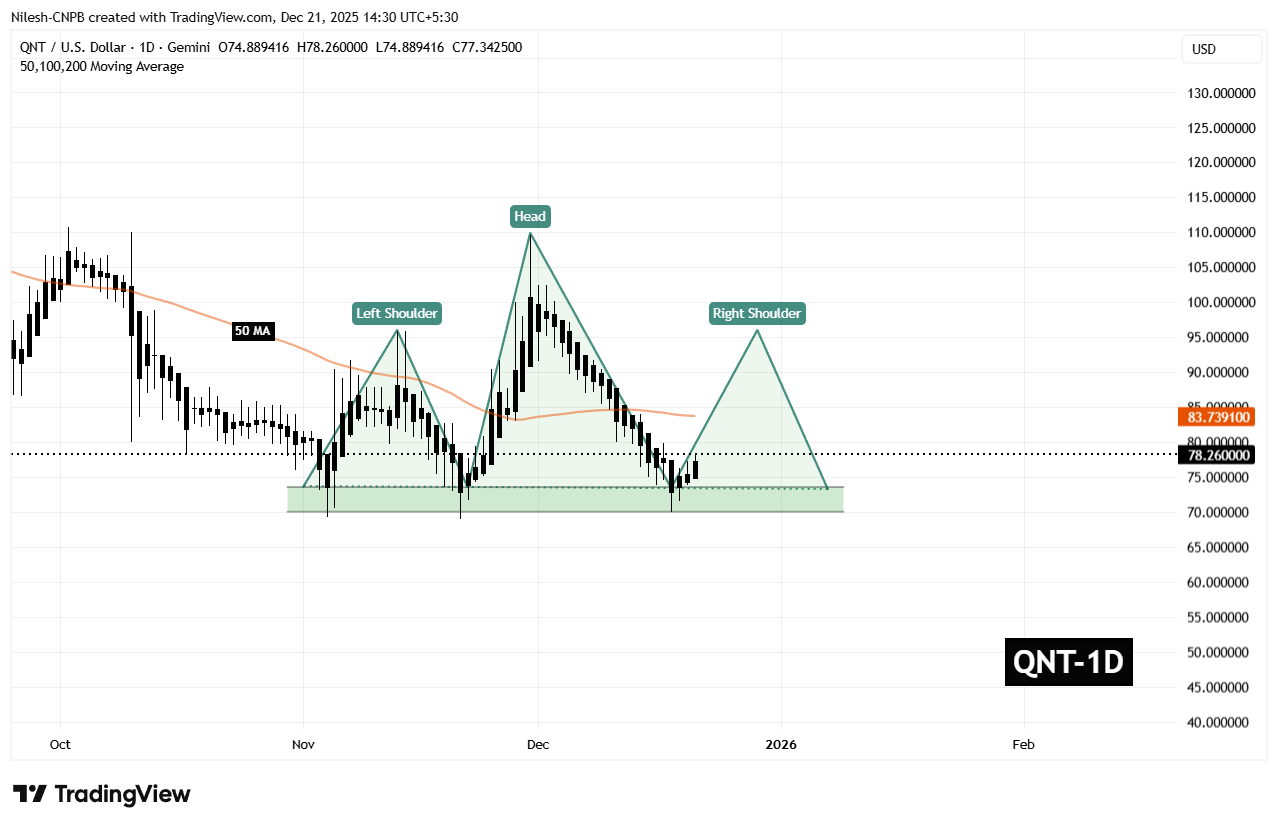
Quant (QNT) Daily Chart/Coinsprobe (Source: Tradingview)
The behavior around this zone is critical. A successful defense of the neckline often opens the door for a relief rally, especially if broader market conditions stabilize.
What’s Next for QNT?
For bullish momentum to build, QNT needs to reclaim the 50-day moving average, currently sitting near $83.73. This level now acts as a key short-term resistance, and a daily close above it would signal a shift in momentum back in favor of buyers.
If that recovery unfolds, the chart points toward a potential move into the $95.90 region. Such a move would represent a rebound of roughly 22% from current levels and align with the typical reaction seen during the right-shoulder phase of this pattern. A rally of this nature would not only ease recent selling pressure but also place QNT back into a more neutral technical posture.
That said, the setup remains delicate. If the $70 neckline support fails to hold on a sustained basis, the head and shoulders structure would remain bearish, opening the door to further downside and extending the corrective phase. For now, all eyes remain on how price behaves around this key support and whether buyers can regain control above the moving average.
Disclaimer: The views and analysis presented in this article are for informational purposes only and reflect the author’s perspective, not financial advice. Technical patterns and indicators discussed are subject to market volatility and may or may not yield the anticipated results. Investors are advised to exercise caution, conduct independent research, and make decisions aligned with their individual risk tolerance.
Disclaimer: The information on this page may come from third parties and does not represent the views or opinions of Gate. The content displayed on this page is for reference only and does not constitute any financial, investment, or legal advice. Gate does not guarantee the accuracy or completeness of the information and shall not be liable for any losses arising from the use of this information. Virtual asset investments carry high risks and are subject to significant price volatility. You may lose all of your invested principal. Please fully understand the relevant risks and make prudent decisions based on your own financial situation and risk tolerance. For details, please refer to
Disclaimer.
Related Articles
Cardano áp sát mốc 0,28 USD khi lực mua nhỏ lẻ tăng mạnh – Đà bứt phá đã cận kề?
The current price of Cardano (ADA) is around $0.270, having risen from a support level of $0.254-$0.260. It underwent a dip to $0.2194 before buyers returned, leading to a structure indicating accumulation. The price tests resistance at $0.287, while whale activity raises market uncertainty. Despite a reduction in ADA holdings among large wallets, the supply remains concentrated in their hands, suggesting strategic liquidity reallocation rather than widespread selling. Meanwhile, retail investors continue accumulating ADA.
TapChiBitcoin1h ago
Bitcoin MVRV Z-Score Drops Below 1 Again
The MVRV Z-Score is a key on-chain indicator for assessing Bitcoin's value by comparing market and realized capitalizations. Historical data shows that when the score drops below 1, it often signals significant market recovery. However, changing market dynamics and institutional influences may alter future patterns.
Coinfomania1h ago
「刻舟求劍」式幣價預測走紅,玄學預言的實戰邏輯與缺陷
作者:Frank,PANews
每當市場進入不上不下的迷惘階段,就會有人試圖用「刻舟求劍」式的歷史回溯方法去預測下一段走勢。在這種情況下,人們往往能從這些理論和圖表中看到歷史總是在重演,並似乎自動將未來一段時間的行情走勢與過去的某一段進行重疊驗證。
這種重合似乎有著神奇的效果,也常常被驗證。有部落客自稱這種預測的準確率能到達 75%~80% 。
這種在社群媒體上屢屢爆紅的「刻舟求劍」式價格預測,究竟是在幫助市場識別階段,還是在把噪音包裝成預言?
從「滴答分形」到「歷史押韻」
關於 2025 年 10 月市場頂點預測的巔峰操作是名為 CryptoBullet 的分析師,他所創建的一種名為「ti
区块客2h ago
Dogecoin (DOGE) Prints Abnormal $0 as Short Sellers Disappear - U.Today
Dogecoin's recent rally saw $0 in short liquidations, indicating traders were betting long. Despite a 4.61% decline due to market pullback, volume remained high. The potential for DOGE to reach $0.10 depends on Bitcoin's recovery.
UToday2h ago
Bitcoin Holds Steady Amid Middle East Escalation
Bitcoin demonstrates resilience at $70K amid geopolitical tensions in the Middle East, with declining exchange-held Bitcoin indicating investor confidence. Market reactions reflect a growing stability, despite volatility from conflict risks.
CryptoFrontNews3h ago
Liệu Dogecoin có chững lại trong một phạm vi giá kéo dài nhiều tuần bất chấp đợt tăng giá 15%?
Dogecoin (DOGE) has successfully defended the crucial support level of $0.088 despite recent selling pressure, aided by Bitcoin's recovery. While DOGE saw a significant 15% increase recently, long-term trends remain bearish. Rising social media interactions and potential short liquidations could drive short-term growth, but long-term recovery may require surpassing $0.127.
TapChiBitcoin4h ago