
Date: Fri, Dec 26, 2025 | 06:30 PM GMT
The broader cryptocurrency market has been navigating a period of choppy and uncertain price action over the past several weeks, a phase that began after the sharp market-wide sell-off on October 10. During that correction, Ethereum (ETH) dropped nearly 28% over the last 60 days, applying sustained pressure across the altcoin sector — including ether.fi (ETHFI).
ETHFI has mirrored this weakness, sliding more than 31% over the same period. However, despite the sharp downtrend, recent price behavior suggests selling pressure may be easing. The token is now trading near a historically significant demand zone, where buyers have repeatedly stepped in before — raising the possibility that ETHFI could be approaching an inflection point.
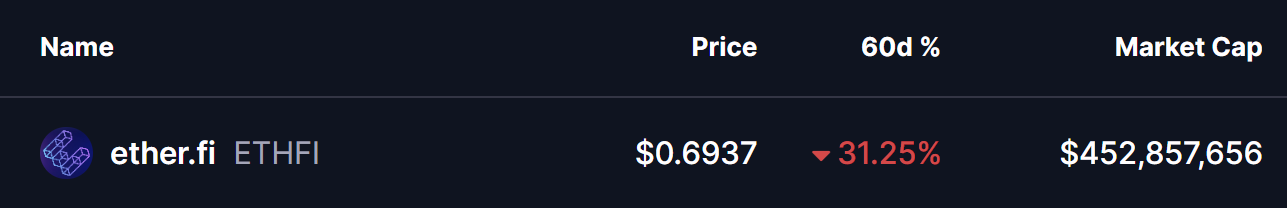
Source: Coinmarketcap
Double Bottom Pattern in Focus
On the daily timeframe, ETHFI appears to be forming a potential double-bottom structure — a classic reversal pattern that often signals exhaustion among sellers. The setup began after ETHFI was rejected from the $0.9233 resistance area, a move that triggered a sharp decline of nearly 28% and pushed price back toward the lower end of its range.
That sell-off dragged ETHFI into the $0.65 support zone, a level that has consistently acted as a strong demand area in the past. The chart now shows price revisiting this same region and stabilizing once again, suggesting buyers are actively defending it. The similarity between the first and second lows strengthens the case that a double-bottom base may be forming.
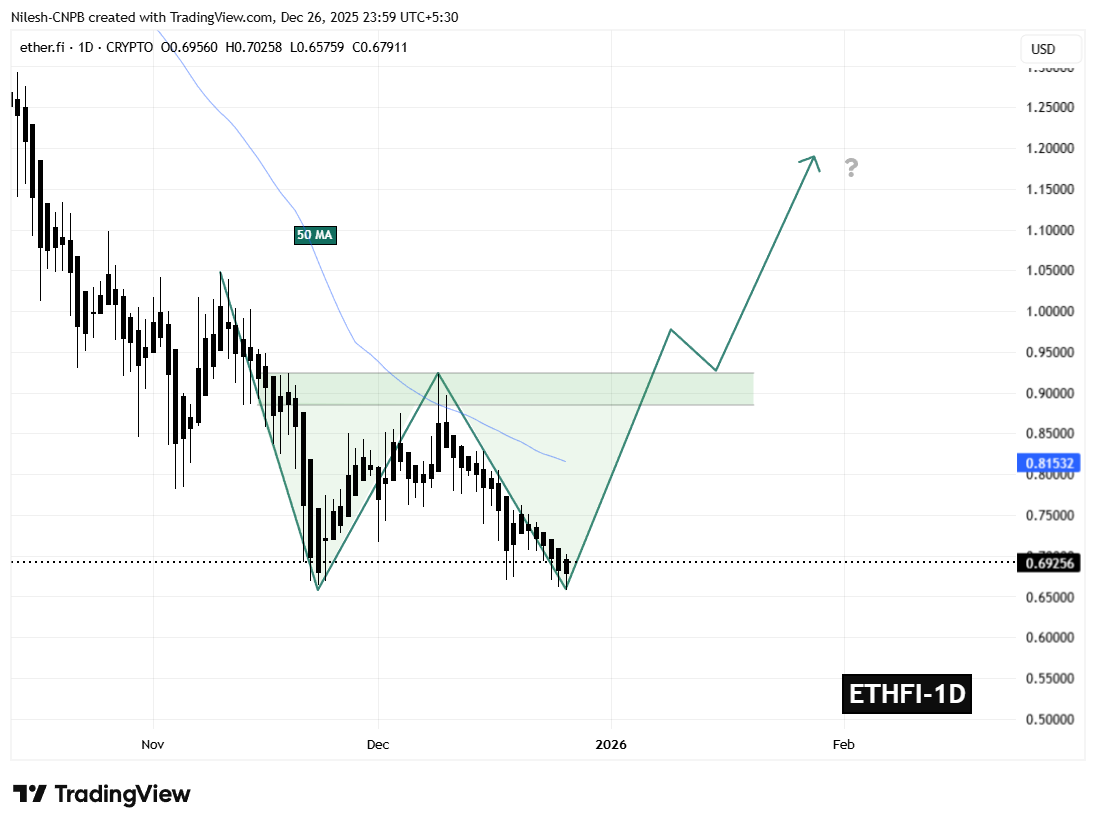
ETHFI Daily Chart/Coinsprobe (Source: Tradingview)
If this support continues to hold, the ongoing consolidation could mark the completion of the second bottom — a critical step in shifting momentum away from sellers and toward a potential trend reversal.
What’s Next for ETHFI?
The $0.65 support zone remains the most important level to monitor in the near term. As long as ETHFI holds above this area, the developing bullish structure remains valid and provides room for momentum to gradually rebuild.
On the upside, the first major challenge sits at the 50-day moving average near $0.8153. This level has repeatedly capped recovery attempts throughout the recent downtrend and now represents the initial test for buyers. A sustained move above this moving average would signal improving market structure and growing bullish confidence.
Beyond that, the $0.9233 neckline stands as the key confirmation level. A decisive breakout above this resistance would complete the double-bottom pattern and significantly strengthen the bullish outlook, potentially opening the door for a broader recovery move in the weeks ahead.
For now, ETHFI finds itself at a technically pivotal zone — one that could either reinforce the existing downtrend or mark the beginning of a meaningful rebound if buyers continue to defend support.
Disclaimer: The views and analysis presented in this article are for informational purposes only and reflect the author’s perspective, not financial advice. Technical patterns and indicators discussed are subject to market volatility and may or may not yield the anticipated results. Investors are advised to exercise caution, conduct independent research, and make decisions aligned with their individual risk tolerance.
Disclaimer: The information on this page may come from third parties and does not represent the views or opinions of Gate. The content displayed on this page is for reference only and does not constitute any financial, investment, or legal advice. Gate does not guarantee the accuracy or completeness of the information and shall not be liable for any losses arising from the use of this information. Virtual asset investments carry high risks and are subject to significant price volatility. You may lose all of your invested principal. Please fully understand the relevant risks and make prudent decisions based on your own financial situation and risk tolerance. For details, please refer to
Disclaimer.
Related Articles
Bitcoin Rebounds Without Increase in Open Interest, May Still Be Range-Bound
On March 19, when Bitcoin's price declined, open interest (OI) rose instead, showing that short positions increased, with price touching around $68,750. The current rebound lacks new long position support and appears more like range-bound consolidation. Attention should be paid to changes in price and OI.
GateNews1m ago
Stock, bond, and gold triple sell-off: When safe-haven assets fail, is cash king really the right answer?
Since late February 2026, when the US and Israel launched military operations against Iran, geopolitical risks in the Middle East have escalated, causing dramatic shifts in global capital markets. Gold and US Treasury bonds have shown weakening hedging effects, while the US S&P 500 Index has declined 4%, indicating asset repricing. Capital flows have moved toward money market funds with high liquidity, signaling that markets have entered a defensive "cash is king" phase. Bitcoin has posted modest gains but faces continued risks.
ChainNewsAbmedia1m ago
Hyperliquid surpasses 1 billion USD in liquidity
Hyperliquid is rapidly expanding its liquidity and market share, surpassing $1 billion in stablecoin and adding $1 billion in open interest last month. Growth is fueled by trades on HIP-3, reflecting a shift to traditional assets. Token HYPE shows strong performance but faces selling pressure and volatility.
TapChiBitcoin2m ago
Crypto Market Records Downturn As Fear Again Dominates Investor Sentiment
The crypto market has declined, with a total capitalization of $2.42T and a 24-hour volume drop of 6.08%. Bitcoin and Ethereum saw minor decreases, while notable gainers included $BPX and $PENGU. DeFi TVL fell by 1.56%, and NFT sales dropped 14.62%. Morgan Stanley updated its Bitcoin ETF filing, while Gemini faces a lawsuit for misleading investors.
BlockChainReporter21m ago
The Real Reason Bittensor (TAO) Price Just Pumped 30%
Bittensor's TAO surged 30% to $299, driven by endorsements from top figures like NVIDIA's Jensen Huang. Technical indicators suggest a bullish trend, eyeing resistance at $341, with strong market interest and trading volume signaling potential for ongoing recovery.
CaptainAltcoin26m ago
Bitcoin Briefly Falls Below $70,000 Mark During Asian Session as Fed Hawkishness and Macro Uncertainty Weigh on Market Volatility
Bitcoin fell below 70,000 on March 19, touching approximately 69,537, reflecting market concerns about the Federal Reserve maintaining high interest rates. Bitcoin subsequently rebounded to around 70,180, demonstrating psychological support at the 70,000 level. Despite improved market fund inflows, cryptocurrencies continue to face challenges amid global macroeconomic pressures, with 70,000 becoming a critical near-term level.
区块客56m ago
