
**Date: **Wed, Jan 07, 2026 | 05:26 AM GMT
The broader cryptocurrency market continues to show strong New Year momentum, with Bitcoin (BTC) up around 5% and Ethereum (ETH) posting gains of more than 9% on a weekly basis. While several altcoins have already accelerated higher, the privacy-focused cryptocurrency** Monero (XMR)** has moved at a more measured pace.
That said, XMR’s recent price behavior on the daily chart tells a more constructive story. Despite relatively modest weekly gains, the structure suggests that Monero is undergoing a healthy bullish retest — often a critical phase before the next leg higher.
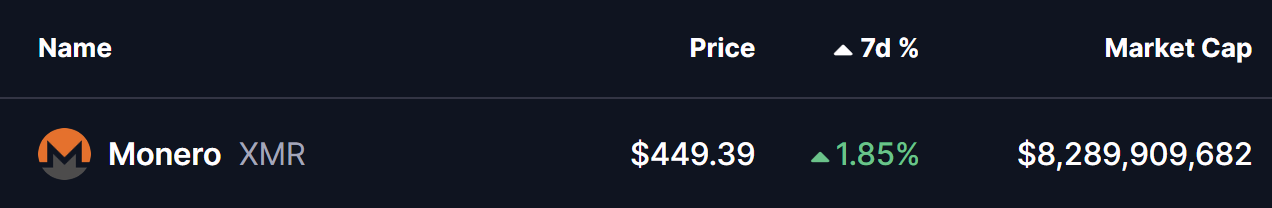
Source: Coinmarketcap
Retested Cup and Handle Breakout
On the daily timeframe, XMR had been consolidating within a well-defined Cup and Handle formation, a classic bullish continuation pattern that typically forms after an extended accumulation phase.
The pattern resolved to the upside when buyers decisively pushed price above the $412–$420 neckline resistance. This breakout sparked a sharp rally of nearly 20%, sending XMR to a local high around $498.30 and confirming a clear shift in market structure toward bullish control
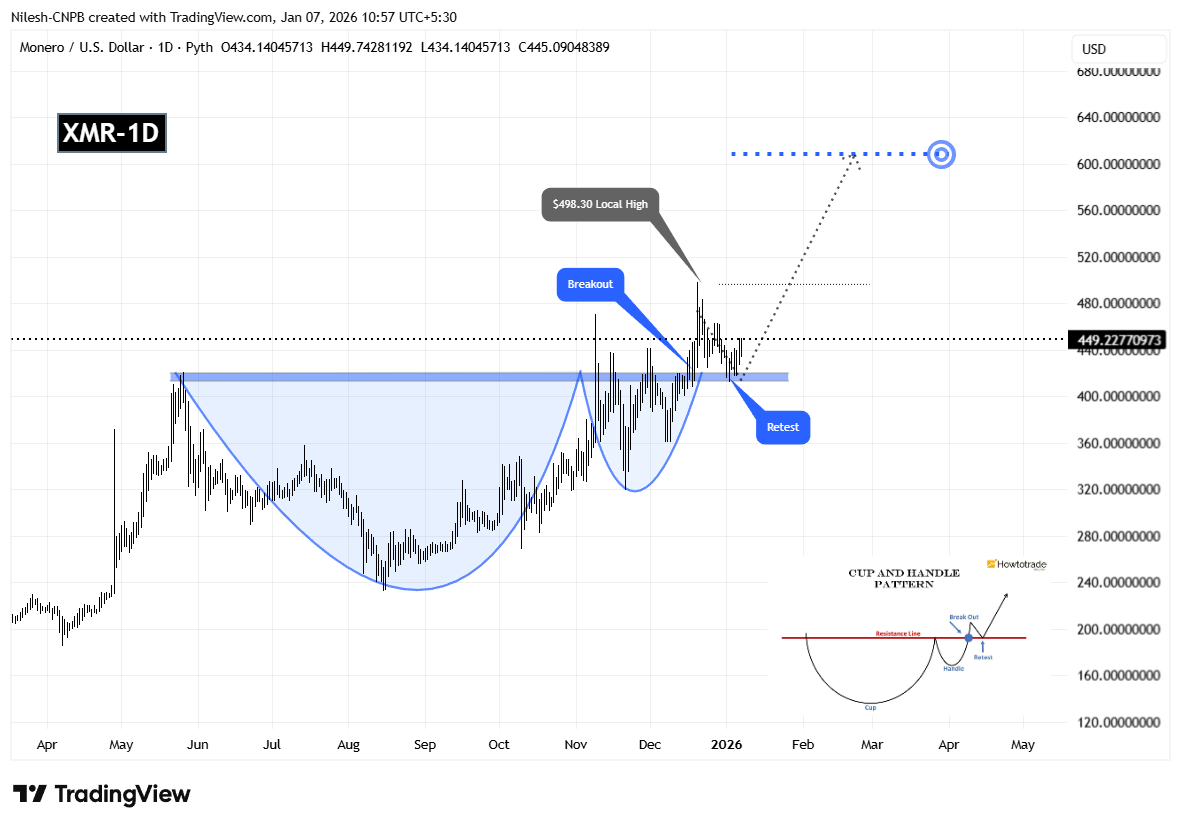
Monero (XMR) Daily Chart/Coinsprobe (Source: Tradingview)
As expected after such a strong breakout, price then pulled back to retest the former resistance zone. XMR dipped back into the $412–$420 area, allowing the market to validate this region as new support. This retest has so far been successful, with price rebounding and currently trading near the $449 level. The ability to hold above the breakout zone reinforces the strength of the underlying trend and suggests growing acceptance at higher prices.
What’s Next for XMR?
As long as buyers continue to defend the $412–$420 support area, the broader bullish structure remains firmly intact. A sustained move back above the recent swing high near $498 would likely signal renewed upside momentum and open the door for continuation of the breakout trend.
Based on the depth of the cup formation, the technical upside projection points toward the $608 region. Reaching this level would imply a potential upside of roughly 35% from current prices, consistent with the measured-move expectations of this pattern.
On the downside, a failure to hold the $412–$420 zone could temporarily slow bullish momentum and lead to additional consolidation. However, unless price slips back toward the lower portion of the cup, the broader structure would still remain constructive.
From a technical perspective, XMR’s current behavior reflects a textbook breakout-and-retest scenario. If market conditions remain supportive, this structure suggests Monero could be positioning itself for another meaningful move higher in the weeks ahead.
Disclaimer: The views and analysis presented in this article are for informational purposes only and reflect the author’s perspective, not financial advice. Technical patterns and indicators discussed are subject to market volatility and may or may not yield the anticipated results. Investors are advised to exercise caution, conduct independent research, and make decisions aligned with their individual risk tolerance.
About Author: Nilesh Hembade is the Founder and Lead Author of Coinsprobe, with over 5 years of experience in the cryptocurrency and blockchain industry. Since launching Coinsprobe in 2023, he has been providing daily, research-driven insights through in-depth market analysis, on-chain data, and technical research.
Disclaimer: The information on this page may come from third parties and does not represent the views or opinions of Gate. The content displayed on this page is for reference only and does not constitute any financial, investment, or legal advice. Gate does not guarantee the accuracy or completeness of the information and shall not be liable for any losses arising from the use of this information. Virtual asset investments carry high risks and are subject to significant price volatility. You may lose all of your invested principal. Please fully understand the relevant risks and make prudent decisions based on your own financial situation and risk tolerance. For details, please refer to
Disclaimer.
Related Articles
Dogecoin Prints Monthly Morning Doji Star — Will $0.097 Break Next?
Dogecoin is forming a "Morning Doji Star" pattern on the monthly chart around $0.09, indicating a potential bullish reversal despite a recent 1.9% daily decline. Key support is at $0.09036 and resistance at $0.09707, with current trading at $0.09010.
CryptoNewsLand1m ago
Here’s the XRP Price If Banks Start Treating Ripple as the Ultimate “Integration Play”
Ripple’s XRP price moved up a bit today, but the overall picture still feels uncertain. The token dropped heavily over the past few months, and many traders are still careful.
Online discussions show mixed feelings. Some think the recent drop may have formed a short-term bottom. However, many
CaptainAltcoin17m ago
Bitcoin Price Predictions Flip Bullish, But Ethereum Is Still Stuck
Predictors have turned bullish on Bitcoin's near-term price, suggesting a rise to $84,000 before a potential drop. However, analysts remain divided on sustainability, while sentiment for Ethereum is bearish, with expectations of a decline to $1,500.
Decrypt52m ago
SHIB Faces Critical Breakout Test as Forecast Points to Short-Term 7.47% Gain
Shiba Inu (SHIB) is trading close to the support level of $0.05545, showing a recent decline but also potential for a 7.47% upside by March 2026. The price remains within established boundaries, facing key resistance at $0.055727. Future movements depend on breaking above resistance or falling below support.
CryptoNewsLand53m ago
XRP Reclaims $1.39 After $1.69M Liquidation Spike — Can Price Break $1.43 Today?
XRP has rebounded to $1.39 after an 8.2% gain, following a significant liquidation event that targeted overleveraged long positions. Current support is at $1.27, with resistance at $1.43. Market dynamics suggest cautious bullish momentum may continue, while bearish pressure could emerge if resistance fails.
CryptoNewsLand56m ago
ETH short-term decline of 1.12%: macro liquidity disturbances and whale position reduction resonance intensify volatility
On March 5, 2026, from 16:00 to 16:15 (UTC), the price of Ethereum (ETH) recorded a -1.12% return within 15 minutes, with a price range of 2056.69 to 2087.34 USDT, and an amplitude of 1.47%. Market attention during this period significantly increased, volatility intensified, mainstream coins experienced a synchronized pullback, and short-term traders engaged in frequent speculative battles.
The main driver of this fluctuation is macro-level liquidity disturbances. As the Federal Reserve's interest rate decision approaches and the U.S. non-farm payroll data is set to be released on March 6, the market shows divergence in the pace of rate cuts, prompting some short-term funds to choose
GateNews1h ago

