Over the past weekend, Bitcoin (BTC) recorded a fall of 5.6%, from 91,400 USD to below 86,000 USD. The latest jobs report in America showed an addition of 119,000 jobs in September, while other economic data has been delayed due to the prolonged government shutdown. Therefore, the assessments that the crypto market has bottomed out may be premature.
The Quant coin (QNT) is also significantly affected by the strong fluctuations of the entire market. According to a recent report by Coinphoton, the large supply zone just below the psychological level of 100 USD is playing an important resistance role.
On Sunday, the price of QNT rose to 105 USD, raising hopes for a new growth phase. However, the subsequent correction in the following hours caused the price of QNT to return to this supply zone.
Technical Analysis
The fact that the price of QNT has fallen below the previous high bottom (orange) at 85.52 USD has confirmed the bearish structure on the weekly frame. The levels of 58.6 USD and 135.6 USD are currently important price areas to watch in the long term.
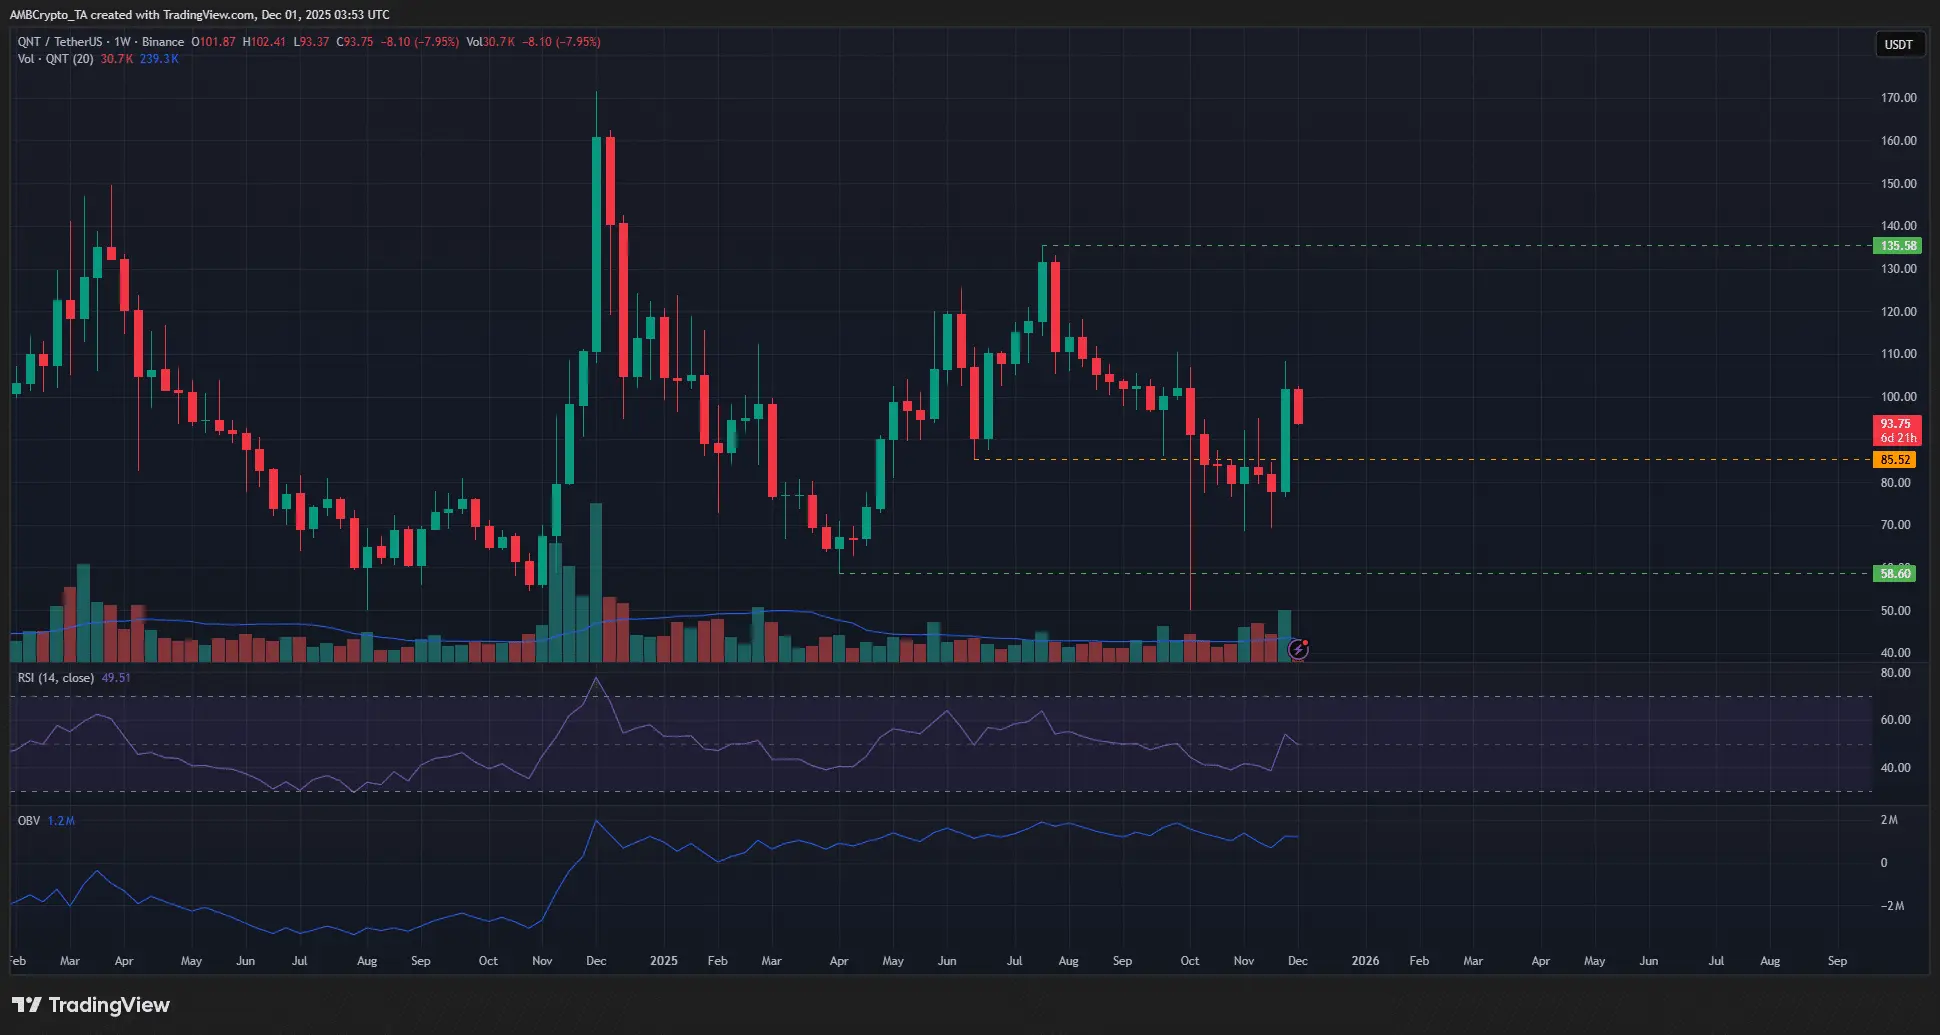 Source: TradingViewThe price increase over the past week has brought QNT to the supply zone around 100 USD, and currently, the price is showing signs of a slight adjustment from this area.
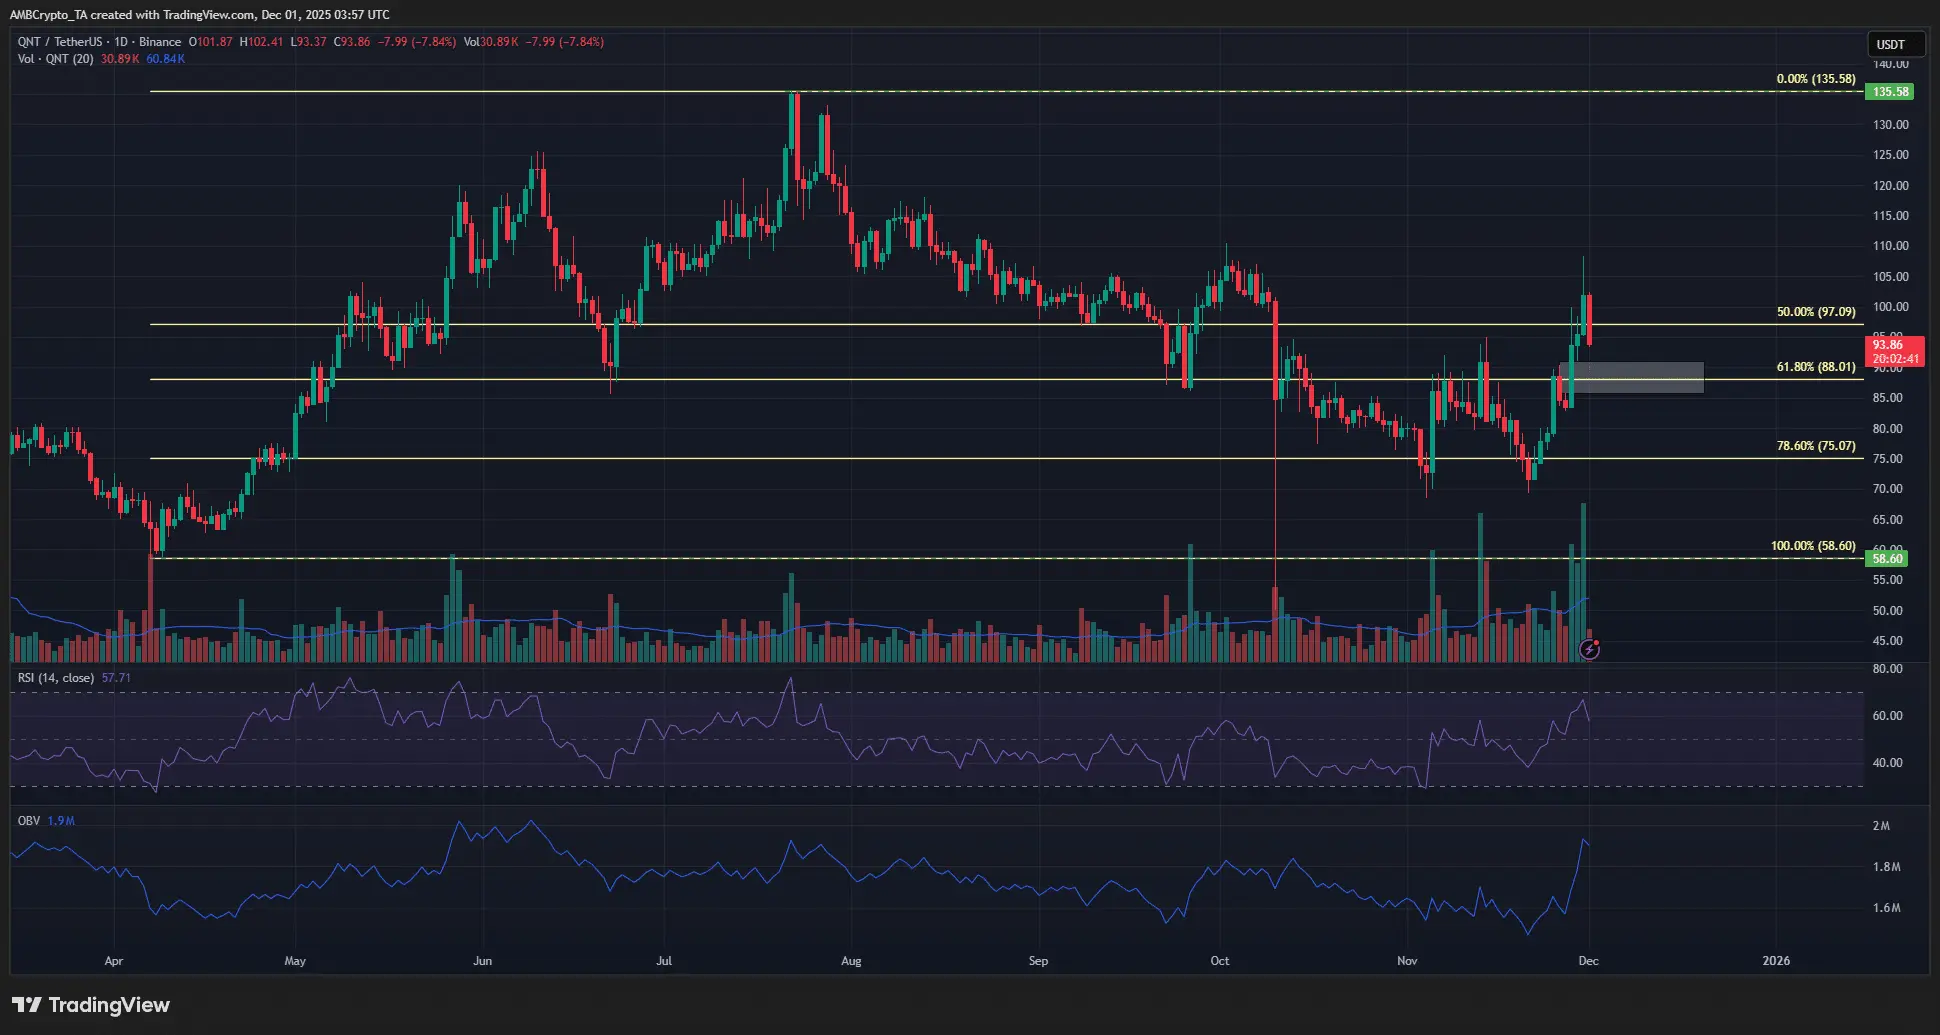 Source: TradingViewOn the daily chart, the price structure still leans towards an upward trend. Notably, the Fibonacci retracement level of 78.6% at 75 USD has been successfully defended in November, paving the way for the recent rally to surpass the previous peak.
However, the resistance level of 105 USD from September has not yet been broken, which poses a challenge for wave traders. The imbalance area (white box) and the Fibonacci level of 61.8% at 88 USD may serve as important support points if the price continues to adjust.
Evaluating Technical Indicators
The OBV indicator on the weekly timeframe has continuously fallen since August, and this trend also appears on the daily chart. However, the recent surge in buying volume has created a new peak. If this buying pressure continues to be sustained, the possibility of QNT recovering from the 105 USD range is entirely feasible.
The RSI indicator on the weekly chart is showing signs of a reversal towards an uptrend, while on the daily chart, the RSI also maintains a positive state. Overall, all technical indicators support a bullish scenario after the market correction.
Important price levels to watch
Analyzing the factors, the level of 110.8 USD is identified as an important resistance on the weekly chart. If the price surpasses this mark, QNT will establish a bullish structure on the larger time frame. This week, a correction towards the range of 85.7 USD – 88 USD may occur, and it is highly likely that buying pressure will dominate here.
On the contrary, if the price breaks below 85 USD, this will indicate that the sellers are in control, and traders should wait for a price reaction at the Fibonacci level of 75 USD – an area that previously played an important support role last November.
Mr. Giáo
Disclaimer: The information on this page may come from third parties and does not represent the views or opinions of Gate. The content displayed on this page is for reference only and does not constitute any financial, investment, or legal advice. Gate does not guarantee the accuracy or completeness of the information and shall not be liable for any losses arising from the use of this information. Virtual asset investments carry high risks and are subject to significant price volatility. You may lose all of your invested principal. Please fully understand the relevant risks and make prudent decisions based on your own financial situation and risk tolerance. For details, please refer to
Disclaimer.
Related Articles
XRP Ledger reaches 120 TPS, activity surges but the price remains "stagnant."
The XRP ledger is experiencing unusual activity, processing 600-700 transactions per block and over 120 transactions per second without increasing fees. This surge is mainly due to decentralized exchange (DEX) activities, particularly mass order cancellations. Despite the increase in on-chain activity, XRP's price has not reacted, indicating a disconnect between network activity and market response.
TapChiBitcoin3m ago
Today’s Crypto Fear and Greed Index has fallen to 9, and the market is in extreme fear.
Gate News message, March 29, according to data from Alternative.me, today the Crypto Fear & Greed Index has fallen to 9, down further from yesterday’s 12, and the market is still in an “extreme fear” state.
GateNews1h ago
Bittensor (TAO) Hits a 3-Month Peak: What Caused the Rally and What Comes Next?
Many leading cryptocurrencies have posted slight declines or negligible increases over the past 24 hours, but this isn’t the case for Bittensor (TAO), whose price soared by 15%.
The question now is whether this momentum can hold or if a pullback is coming next.
Further Gains
CryptoPotato2h ago
ETH falls 0.85% in 15 minutes: Exchange outflows and ETF trimming in sync amplify volatility
From 23:00 to 23:15 (UTC) on March 28, 2026, the price of ETH fluctuated downward within the range of 1,989.32 to 2,012.0 USDT, recording a return of -0.85%, with a volatility of 1.13%. During this period, market attention increased, and short-term fluctuations intensified, prompting traders to closely monitor the performance of key support zones.
The main driver of this volatility is the continuous outflow of ETH from major exchanges to on-chain wallets since March, with a total outflow of 31.6 million coins, leading to a contraction in exchange liquidity and causing prices to be sensitive to large orders. Meanwhile,
GateNews2h ago
Is the XRP Bottom Finally Here? 3 Massive Bullish Signals You Need to See
Although in a more modest manner, XRP whales have returned to the scene, amassing more tokens over the past week, which is categorized as the first bullish sign for the underlying asset.
Another could come in the form of the technical tool used to determine whether that asset’s move in either
CryptoPotato3h ago
