Date: Thu, Dec 18, 2025 | 07:10 AM GMT
The broader cryptocurrency market has been experiencing choppy price action over the past several weeks, a phase that began after the sharp sell-off on October 10. That correction dragged Ethereum (ETH) down by nearly 22% over the last 60 days, keeping pressure firmly on major altcoins — including Avalanche (AVAX).
AVAX has slipped more than 12% over the past week alone, extending its 60-day decline to over 41%. While the short-term trend remains weak, a closer look at the higher-timeframe chart suggests that the sell-off may be approaching an area where downside momentum starts to fade.
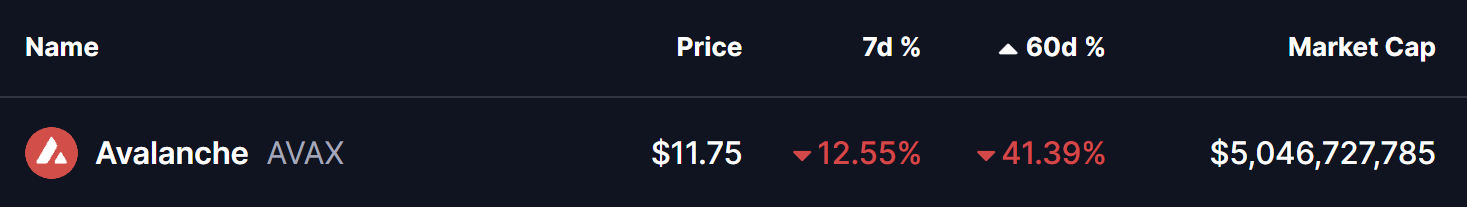
Source: Coinmarketcap
Falling Wedge Pattern in Play
On the weekly chart, AVAX continues to trade inside a well-defined falling wedge pattern. This structure has been guiding price action since early 2024 and is characterized by lower highs and lower lows that gradually compress into a narrowing range. Historically, falling wedges often reflect slowing selling pressure rather than aggressive distribution.
As shown on the chart, the latest decline has pushed AVAX directly into the lower boundary of this wedge, near the $11.64 region. This zone has acted as a critical demand area in the past, repeatedly attracting buyers and triggering short-term rebounds. Once again, price is reacting near this level, suggesting that sellers may be losing strength as AVAX presses into long-term support.
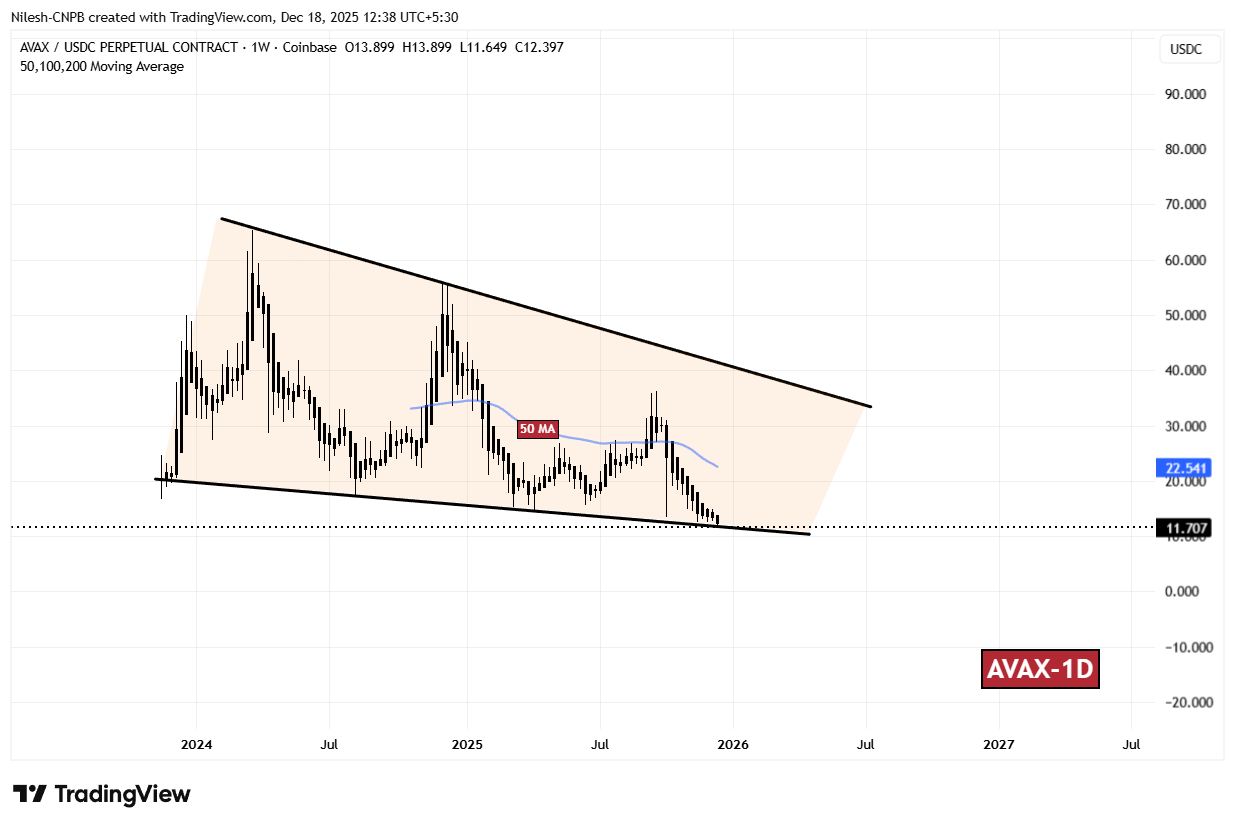
AVAX Weekly Chart/Coinsprobe (Source: Tradingview)
The repeated defenses of the wedge’s lower trendline, combined with shrinking downside follow-through, point to growing indecision rather than panic selling. This behavior often precedes a stabilization phase or a relief bounce.
What’s Next for AVAX?
If AVAX continues to hold above the wedge floor, the focus will shift to whether buyers can reclaim key overhead levels. The first major hurdle sits at the 50-week moving average, currently near $22.54. This level has consistently acted as dynamic resistance during prior recovery attempts and remains a key marker for any trend change.
A sustained move above this moving average would strengthen the bullish case and potentially open the door for a push toward the upper boundary of the falling wedge. Reaching that zone would signal a meaningful shift in market structure and sentiment.
That said, the setup remains conditional. A decisive weekly close below the wedge’s lower boundary would invalidate the pattern and expose AVAX to further downside risk, with the next notable support area emerging near the $9.00 level.
For now, AVAX sits at a technically important crossroads. While broader market conditions remain fragile, the compression within this falling wedge suggests that a larger move may be approaching — with the coming weeks likely to determine whether this support zone becomes a base for recovery or a stepping stone to deeper losses.
Disclaimer: The views and analysis presented in this article are for informational purposes only and reflect the author’s perspective, not financial advice. Technical patterns and indicators discussed are subject to market volatility and may or may not yield the anticipated results. Investors are advised to exercise caution, conduct independent research, and make decisions aligned with their individual risk tolerance.
Disclaimer: The information on this page may come from third parties and does not represent the views or opinions of Gate. The content displayed on this page is for reference only and does not constitute any financial, investment, or legal advice. Gate does not guarantee the accuracy or completeness of the information and shall not be liable for any losses arising from the use of this information. Virtual asset investments carry high risks and are subject to significant price volatility. You may lose all of your invested principal. Please fully understand the relevant risks and make prudent decisions based on your own financial situation and risk tolerance. For details, please refer to
Disclaimer.
Related Articles
Tether’s USDT Stablecoin Gears Up To Flip Ethereum In Market Cap
An ongoing event contract on Polymarket indicates Ethereum could lose its spot as the second-largest crypto by market cap this year.
Analysts expect Tether’s USDT stablecoin to overtake ETH’s overall valuation within the same period.
An ongoing event contract in Polymarket predicts Ethereum (ETH)
Blockzeit2m ago
Cardano’s Treasury Spent Millions While ADA Price Sinks – Community Demands Answers!
Cardano's recent drop to 13th place on CoinMarketCap has frustrated long-time holders, as the project struggles to recover its market cap. Community member Bobcorn criticizes treasury spending, arguing it benefits developers while investors suffer losses. The divide persists, with some supporting infrastructure investments for future growth, while others see them as wasteful during poor performance.
CaptainAltcoin8m ago
Bitcoin Faces Extended Weakness Below Key Cost Basis
Bitcoin struggles below the $72.5K realized price, indicating resistance and prolonged bearish sentiment. Repeated rejections at $71K and a drop to $66K demonstrate strong selling pressure. Indicators suggest fragile recovery, with risks of further declines if support fails.
CryptoFrontNews23m ago
The cryptocurrency market's trading volume has dropped back to the levels of the 2022 bear market, with ETH's trading volume decreasing more than BTC's, and Gas fees hitting an all-time low.
The average weekly trading volume in the cryptocurrency market has fallen to $90 billion, a decrease of 7% from the mean, indicating that activity has dropped to levels seen during the bear market of 2022; Ethereum gas fees have fallen to historic lows, reflecting a contraction in on-chain activity. Both Bitcoin and Ethereum trading volumes are below the average, with funding rates recovering but still at low levels. The market is currently in a quiet state, lacking clear catalysts.
動區BlockTempo33m ago
RAIN Crypto Price Dips: Will the $10M Sell-Off Halt Recovery?
RAIN drops over 17% after $10M sell-off despite institutional support.
RAIN trades below key $0.0082 support, raising concerns about market cap decline.
Whale activity and green candles suggest potential rebound if momentum sustains.
Rain Protocol — RAIN, has seen a sharp decline,
CryptoNewsLand47m ago
‘Extreme Fear’ Is Back but Bitcoin’s Price Recovery Depends on it: Santiment
Bitcoin dipped to a four-week low on Friday at $65,500 after it was rejected at $72,000 a few days earlier, which pushed the overall market sentiment back to ‘extreme fear’ territory.
However, the analysts from Santiment believe this could be the precise push BTC needs to stage a notable
CryptoPotato1h ago
