Date: Fri, Dec 19 2025 | 12:45 PM GMT
The broader cryptocurrency market is showing relative strength despite concerns around the Japan rate hike. Cooling U.S. inflation has helped both Bitcoin (BTC) and Ethereum (ETH) hold in the green, and this stability is beginning to spill over into select altcoins, including Stellar (XLM).
XLM has posted modest gains today, but beyond the short-term price move, the daily chart is starting to reveal an emerging technical structure that could set the stage for a more meaningful recovery if key levels continue to hold.
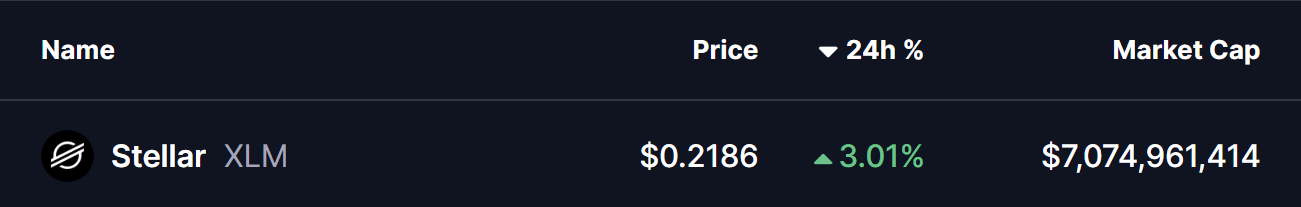
Source: Coinmarketcap
Harmonic Pattern Signals Potential Upside
On the daily timeframe, XLM appears to be forming a Bearish Cypher harmonic pattern — a setup that often generates upside momentum during its final CD leg before price reaches the Potential Reversal Zone (PRZ).
The pattern began at point X near the $0.3113 region, where XLM topped out before entering a sharp corrective phase. Price then declined into point A, followed by a rebound toward point B. From there, XLM rolled over again and extended lower into point C around the $0.2029 area, completing the core structure of the pattern.
Since tagging this low, XLM has started to stabilize and grind higher, currently trading near the $0.2188 level. This slow but steady recovery suggests that selling pressure may be fading, with buyers beginning to defend the recent lows more aggressively.
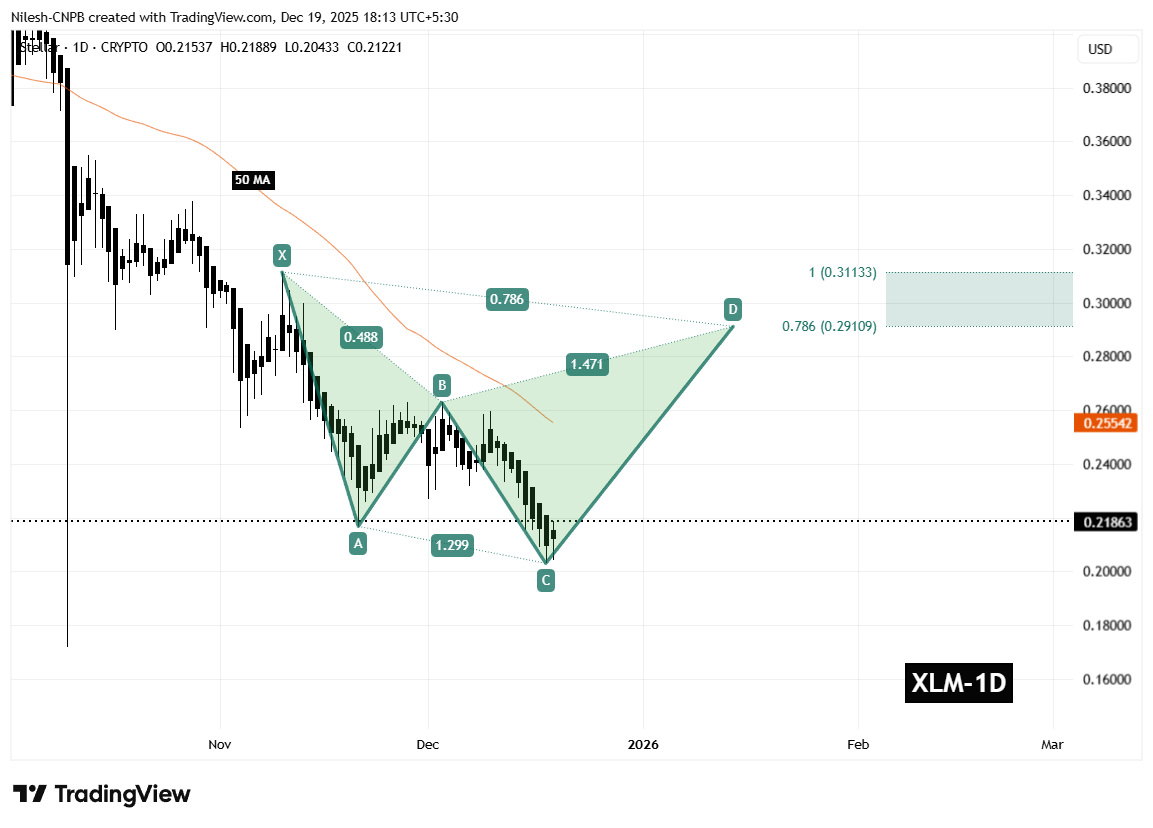
Stellar (XLM) Daily Chart /Coinsprobe (Source: Tradingview)
A key technical factor aligning with this structure is the 50-day moving average, currently positioned near $0.2554. This moving average has consistently acted as dynamic resistance throughout the downtrend and represents an important hurdle for bulls to overcome in the near term.
What’s Next for XLM?
In the short term, the most critical level to monitor is the C-leg support around $0.2029. As long as XLM holds above this zone, the harmonic pattern remains valid and the bullish CD-leg scenario stays intact.
If price continues to build strength from this base, the next major test will be a reclaim of the 50-day moving average near $0.2554. A decisive break and close above this level would signal improving momentum and could accelerate upside continuation.
Based on the harmonic structure, the projected upside targets sit within the Potential Reversal Zone, defined between the 0.786 Fibonacci extension near $0.2910 and the 1.0 extension around $0.3113. Reaching this zone would represent a potential upside of roughly 40–45% from current price levels, making it a key area where profit-taking or stronger resistance could emerge.
On the downside, failure to hold above the $0.2029 support would significantly weaken the bullish setup. A breakdown below this level could invalidate the harmonic structure and expose XLM to deeper downside pressure before any sustainable recovery attempt develops.
For now, the chart suggests Stellar is sitting at an important technical crossroads. While confirmation is still needed, the presence of a well-defined harmonic pattern indicates that a short- to medium-term bounce remains a realistic possibility if buyers continue to defend current levels and reclaim key resistance zones.
Disclaimer: The views and analysis presented in this article are for informational purposes only and reflect the author’s perspective, not financial advice. Technical patterns and indicators discussed are subject to market volatility and may or may not yield the anticipated results. Investors are advised to exercise caution, conduct independent research, and make decisions aligned with their individual risk tolerance.
Disclaimer: The information on this page may come from third parties and does not represent the views or opinions of Gate. The content displayed on this page is for reference only and does not constitute any financial, investment, or legal advice. Gate does not guarantee the accuracy or completeness of the information and shall not be liable for any losses arising from the use of this information. Virtual asset investments carry high risks and are subject to significant price volatility. You may lose all of your invested principal. Please fully understand the relevant risks and make prudent decisions based on your own financial situation and risk tolerance. For details, please refer to
Disclaimer.
Related Articles
ZANO Roars Back, Records 11.2% As Bullish Rectangle Structure Prints Continuing Market Rally: Ana...
Zano (ZANO) coin is experiencing a surge in price and trading volume, reaching $7.25. Analysts note a bullish rectangle pattern indicating sustained upward momentum, reflecting increased demand for privacy-focused cryptocurrencies amid broader market recovery.
BlockChainReporter3m ago
BTC rises 0.74% in 15 minutes: FOMC meeting digestion and short covering drive short-term volatility
Between 2026-03-19 15:45 to 16:00 (UTC), BTC experienced a 15-minute price range of 68787.0 to 69550.9 USDT, achieving a realized return rate of +0.74% with an amplitude of 1.11%. During the same period, market attention increased, short-term volatility intensified, and fund behavior and sentiment indicators both showed concentrated changes.
The primary driver of this price movement was the conclusion of the FOMC meeting, after which the market saw no new bearish catalysts. Some short sellers chose to cover their positions, providing upward momentum to the price in the short term. Additionally, while ETF fund outflows reflected institutional profit-taking, they did not form a sustained trading
GateNews4m ago
Aster (ASTER) Price Rejected Again at $0.80 – Is a Sharp Drop Next?
Aster (ASTER) is once again facing trouble at the $0.80 level, and the repeated rejection is starting to raise concerns. What once looked like a potential breakout is now turning into a clear area of resistance that the price simply can’t overcome.
This level has held firm since December,
CaptainAltcoin7m ago
Bitcoin Price Discovery Mechanism Shifts to Derivatives-Driven Model, 2024 ETF Approval Becomes Key Turning Point
Bitcoin's price mechanism is shifting from spot-driven dynamics to derivative ecosystem influences, with the introduction of financial instruments like futures and options significantly shaping price discovery. Investors are adopting more sophisticated strategies, incorporating Bitcoin into macro asset allocation frameworks, reflecting the market structure's increasing impact on price formation.
GateNews47m ago
Bitcoin Slips Below $70,000 as Fed Rate Pause and Oil Surge Pressure Markets
Bitcoin declined to $70,000 due to steady interest rates from the Federal Reserve and rising energy prices, leading to $600 million in liquidations and increased market volatility, particularly affecting altcoins.
CryptoBreaking47m ago
XRP Climbs 3% Past $1.47 as Breakout Extends on Bitcoin-Led Rally
Key Takeaways
XRP broke above $1.426 resistance after months of consolidation, jumping to $1.47 on surging volume
Trading volume spiked over 250% during the move, indicating strong participation in the breakout
Activity on the XRP Ledger continues climbing, with tokenized real-world assets
CryptoBreaking52m ago
