
Date: Sat, Dec 20 2025 | 07:20 AM GMT
The broader cryptocurrency market has been stuck in a choppy and fragile phase over the past several weeks, a trend that started after the sharp sell-off on October 10. That correction dragged Ethereum (ETH) down by nearly 26% over the last 60 days and kept sustained pressure on most major altcoins. Avalanche (AVAX) has been no exception to this move, remaining firmly under bearish control for much of the period.
AVAX has declined by more than 37% over the past two months, reflecting persistent selling pressure and weak sentiment. However, a closer look at the chart suggests that price action may be transitioning into a more constructive phase. While the short-term trend is still negative, the broader structure is beginning to resemble a potential reversal setup that traders often associate with market bottoms.
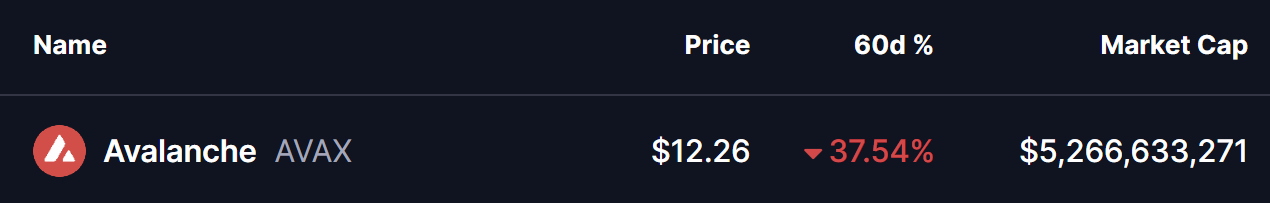
Source: Coinmarketcap
Power of 3 Structure Begins to Take Shape
On the higher-timeframe chart, AVAX appears to be developing a classic Power of 3 formation. This structure typically unfolds in three distinct stages: accumulation, manipulation, and expansion. When it appears near extended downtrends, it can sometimes hint that a larger directional move is approaching.
Earlier in the year, AVAX spent a prolonged period moving sideways within a clearly defined range. Price oscillated between resistance near the $14.82 area and support around $12.74, as highlighted by the gray consolidation zone on the chart. This phase reflected accumulation, where volatility compressed and directional conviction faded. Such conditions often emerge when selling pressure slows and longer-term participants quietly position while retail interest remains subdued.
That calm phase eventually gave way to a sharp breakdown. As broader market weakness intensified, AVAX lost the $12.74 support and slid aggressively lower, reaching a recent low near $11.26. This sudden drop aligns closely with the manipulation phase of the Power of 3 pattern. Moves like this are often marked by heightened fear, stop-loss hunting, and forced liquidations, pushing sentiment to pessimistic extremes.
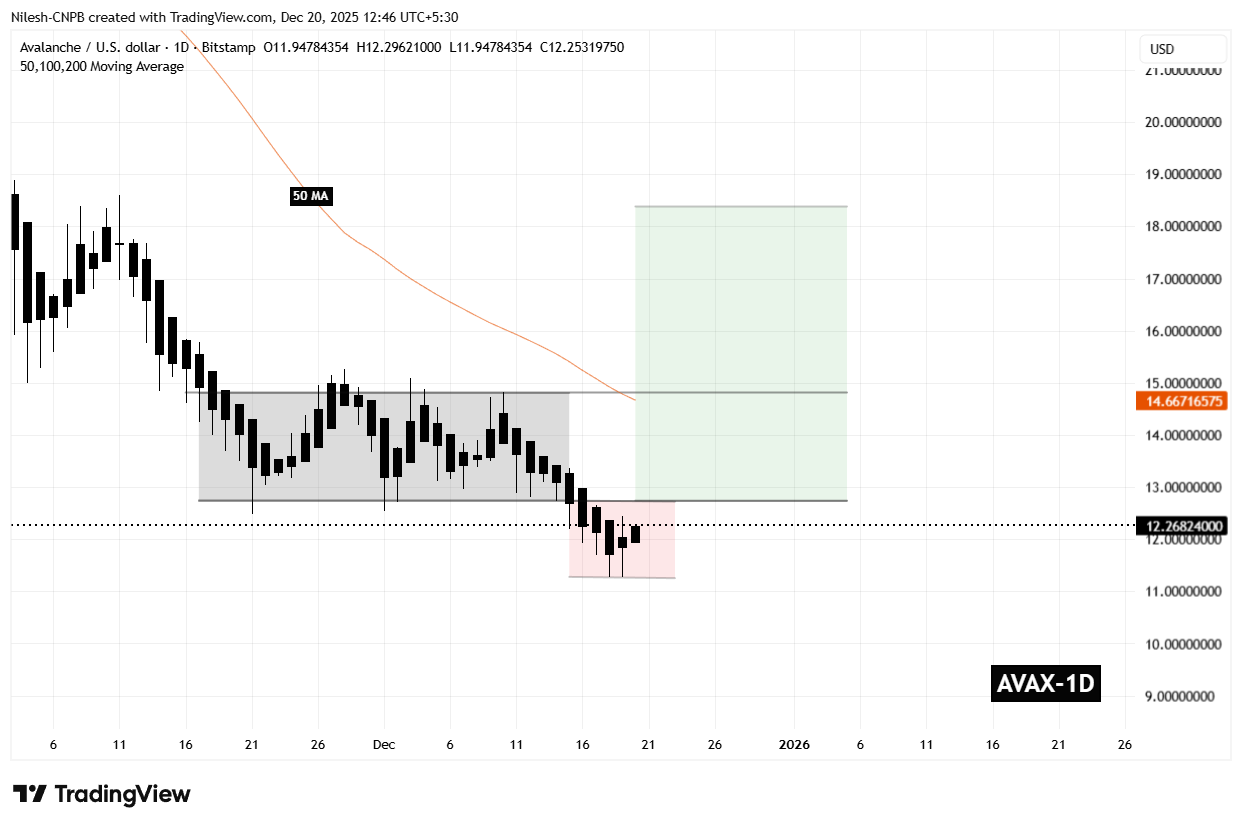
Avalanche (AVAX) Daily Chart/Coinsprobe (Source: Tradingview)
Importantly, downside momentum has started to cool near this lower region. Recent candles show tighter ranges and reduced follow-through, suggesting that selling pressure may be losing strength. This stabilization does not confirm a reversal on its own, but it does indicate that the market may be searching for a base.
What’s Next for AVAX?
At present, AVAX remains trapped near the lower boundary of its recent range, with price hovering around the $12 zone. A period of consolidation at these levels would be consistent with the transition phase that often follows sharp breakdowns. Bulls will need to see clear evidence of strength before confidence can return.
For a bullish reversal narrative to gain credibility, AVAX must reclaim the $12.74 level. A sustained move back above this former support would signal that price has re-entered the prior accumulation range, increasing the probability that the manipulation phase has run its course. From there, a breakout above the $14.82 resistance would mark a shift into the expansion phase of the Power of 3 structure, where upside momentum can accelerate rapidly.
If that breakout occurs, the chart projection points toward the $18.38 region as a potential upside objective. This zone aligns with previous structural resistance and represents a meaningful recovery from current levels.
That said, the setup remains highly conditional. As long as AVAX continues to trade below $12.74, downside risks remain on the table, and further volatility cannot be ruled out. Holding the recent lows and reclaiming key resistance levels will be crucial for bulls looking to confirm that a broader trend reversal is underway.
Disclaimer: The views and analysis presented in this article are for informational purposes only and reflect the author’s perspective, not financial advice. Technical patterns and indicators discussed are subject to market volatility and may or may not yield the anticipated results. Investors are advised to exercise caution, conduct independent research, and make decisions aligned with their individual risk tolerance.
Disclaimer: The information on this page may come from third parties and does not represent the views or opinions of Gate. The content displayed on this page is for reference only and does not constitute any financial, investment, or legal advice. Gate does not guarantee the accuracy or completeness of the information and shall not be liable for any losses arising from the use of this information. Virtual asset investments carry high risks and are subject to significant price volatility. You may lose all of your invested principal. Please fully understand the relevant risks and make prudent decisions based on your own financial situation and risk tolerance. For details, please refer to
Disclaimer.
Related Articles
Glassnode: Is the Bitcoin rebound just a dead cat bounce? Where is the key pressure level?
Glassnode reports that although the Bitcoin price rebounded to $72k due to a U.S.-Iran ceasefire, the market structure is still in a bear market. In the short term, the downside may be limited, but the $78k level faces pressure overhead. ETF capital inflows have ticked up slightly, but they have not yet fully returned; trading activity in derivatives remains sluggish, indicating insufficient market confidence. Going forward, we need to monitor changes in the futures trading and options markets.
ChainNewsAbmedia11m ago
Why is Bitcoin down today? The Iran–Israel ceasefire is on the verge of collapse, and the Strait of Hormuz shuts down again
Bitcoin has recently been trading below $72,000 and faces risks from the failure of the U.S.-Iran ceasefire talks and the Strait of Hormuz closing again, which has weighed on market sentiment. At the same time, Federal Reserve meeting minutes show that the likelihood of further rate hikes is rising, further affecting the valuation of risk assets. Bitcoin’s key resistance level is $75,000 and its support level is $68,000; the market is currently waiting for a clear direction confirmation signal.
MarketWhisper33m ago
The Crypto Fear and Greed Index drops to 14, and the market remains in extreme fear
Gate News message, April 9, according to Alternative data, today’s Crypto Fear and Greed Index is 14 (yesterday was 17), and the market remains in extreme fear. The index ranges from 0-100 and provides a composite assessment of six indicators: volatility (25%), market trading volume (25%), social media buzz (15%), market surveys (15%), Bitcoin’s share of the entire market (10%), and Google trending topic analysis (10%).
GateNews1h ago
Optimism over the Iran-U.S. ceasefire helped drive a broad rebound in U.S. stocks, and Bitcoin rose to a three-week high.
The United States and Iran reached a two-week ceasefire agreement, and global financial markets turned optimistic, with the S&P 500 rising 2.51%. U.S. crude oil prices fell to below $95 per barrel, easing concerns about an energy crisis. Bitcoin at one point rose 5% to $72,841, hitting a three-week high. Expectations that the Federal Reserve will cut interest rates have also increased.
ChainNewsAbmedia1h ago
Bitcoin ETF attracts $470 million, setting a 6-week high! Analyst: “A breakout rally is brewing.”
U.S. spot Bitcoin ETF inflows hit a new six-week high on Monday, signaling a rebound in institutional investor confidence. Total net inflows of $471.3 million came mainly from institutions such as BlackRock and Fidelity. Even though market sentiment is gradually improving, broader macroeconomic and geopolitical risks could still affect Bitcoin’s upward momentum. Analysts said that sustained structural buying can support Bitcoin, but future price action will still need to be monitored for changes in external factors.
区块客1h ago
XRP Traders Face Losses as Supply in Profit Hits Lows
XRP traders are experiencing significant losses, with average wallet returns down 41% and only 43.4% of the supply in profit, indicating broad market declines. The price hovers around $1.33, facing resistance while momentum remains weak.
CryptoFrontNews2h ago
