Date: Sat, Dec 20 2025 | 05:55 PM GMT
The broader cryptocurrency market has continued to struggle with uneven and choppy price action over the past several weeks, a phase that began after the sharp sell-off on October 10. That correction pushed Ethereum (ETH) lower by nearly 26% over the last 60 days, keeping sustained pressure across the altcoin market. Worldcoin (WLD) has been no exception, remaining under heavy selling pressure during this period.
WLD is down more than 44% over the past two months. While the short-term trend still leans bearish, the higher-timeframe chart is starting to show a structure that often appears near potential market turning points. If key technical levels are reclaimed, the current setup could evolve into a broader recovery attempt.

Source: Coinmarketcap
Power of 3 Pattern in Focus
On the higher-timeframe chart, WLD appears to be forming a classic Power of 3 structure, a pattern frequently associated with market cycle lows and trend transitions. This structure typically unfolds in three stages—accumulation, manipulation, and expansion—with the most decisive move usually emerging once the final phase begins.
Earlier, WLD spent an extended period moving sideways within a well-defined range between $0.6528 and $0.5628. This low-volatility environment, highlighted by the grey box on the chart, reflects the accumulation phase. During such phases, price action tightens, volatility fades, and longer-term participants often begin positioning quietly while broader sentiment remains weak or indifferent.
That stability eventually gave way as broader market pressure intensified. WLD broke below the $0.5628 support and slid to a recent low near $0.4721 before attempting a modest rebound. This sharp downside move aligns closely with the manipulation phase of the Power of 3 pattern. Such breakdowns are often designed to trigger stop-losses and force capitulation, shaking out weaker holders before price looks for a base.
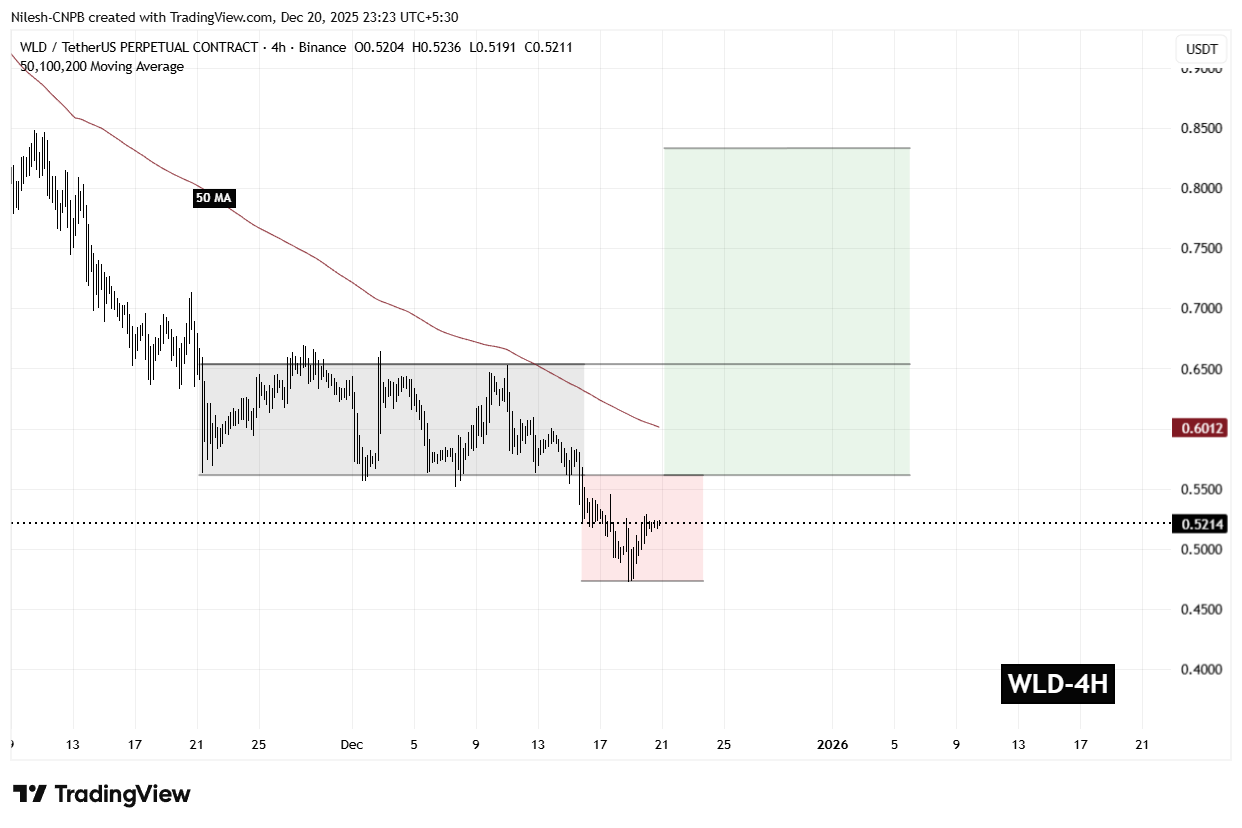
Worldcoin (WLD) 4H Chart/Coinsprobe (Source: Tradingview)
Notably, selling momentum has started to slow near this lower zone. Recent candles show reduced downside follow-through, suggesting that bearish pressure may be losing strength as price consolidates after the breakdown.
What’s Next for WLD?
At the time of writing, WLD continues to trade within the broader manipulation zone, which calls for caution. Price remains below the 50-period moving average near $0.6012, an area that now acts as an important short-term resistance. A sustained move back above this level would be an early signal that sellers are losing control.
For the bullish scenario to gain traction, WLD needs to reclaim both the $0.5628 level and establish acceptance above the $0.60–$0.65 resistance zone. A successful recovery into this former range would suggest that the manipulation phase has likely concluded and that the market may be transitioning toward the expansion phase of the structure.
If buyers manage to break and hold above $0.6528, the chart projection opens the door for a move toward the $0.83 region, which represents the measured expansion target and implies a potential upside of roughly 59% from current levels.
That said, this setup remains conditional. As long as WLD trades below $0.5628, downside risks cannot be ruled out, and the market remains vulnerable to further volatility. Holding recent lows and reclaiming key resistance levels will be critical for bulls looking to validate a bullish reversal narrative.
Disclaimer: The views and analysis presented in this article are for informational purposes only and reflect the author’s perspective, not financial advice. Technical patterns and indicators discussed are subject to market volatility and may or may not yield the anticipated results. Investors are advised to exercise caution, conduct independent research, and make decisions aligned with their individual risk tolerance.
Disclaimer: The information on this page may come from third parties and does not represent the views or opinions of Gate. The content displayed on this page is for reference only and does not constitute any financial, investment, or legal advice. Gate does not guarantee the accuracy or completeness of the information and shall not be liable for any losses arising from the use of this information. Virtual asset investments carry high risks and are subject to significant price volatility. You may lose all of your invested principal. Please fully understand the relevant risks and make prudent decisions based on your own financial situation and risk tolerance. For details, please refer to
Disclaimer.
Related Articles
AI and Interoperability Lead the Charge – Analyzing Today’s Top Crypto Gainers
The crypto market is currently experiencing a strategic shift in that investor interest has moved from stagnant legacy crypto assets to those that exhibit high utility and technological barriers. According to the latest data from CoinMarketCap’s Gainers list, over the last 24 hours the two
BlockChainReporter20m ago
Bitcoin jolted modestly higher on Iran ceasefire report; oil tumbles 4%
The crypto market experienced a slight recovery following news of a potential one-month ceasefire in negotiations involving U.S. envoys. This led to a drop in oil prices and a brief rise in Bitcoin, with U.S. stock futures also gaining.
CoinDesk2h ago
BlackRock sees AI driving crypto’s next bull phase as altcoin interest fades
Robbie Mitchnick from BlackRock highlighted a shift in crypto investment focus, emphasizing AI's growing importance over new tokens. Investors are concentrating on established assets like Bitcoin and Ethereum, with AI seen as a key driver influencing crypto's future and potential as infrastructure.
CoinDesk2h ago
Shiba Inu Burn Rate Jumps 370% as SHIB Breaks Key Level
Key Insights:
The Shiba Inu burn rate surged over 370% in 24 hours, removing more than 4.2 million tokens and reducing the overall circulating supply significantly.
SHIB price climbed above a key resistance level while forming higher lows, indicating steady accumulation despite declining
CryptoNewsLand3h ago
Solana Reclaims $90 as Golden Cross Signals Renewed Momentum
Solana has surpassed the $90 resistance, aided by a golden cross indicating positive momentum, despite low trading volume. Strong on-chain growth supports price stability, and sustained support above $89.50 could push Solana towards $96, though higher volume is crucial for confirming a breakout.
CryptoNewsLand3h ago
Hyperliquid Gains Traction as ETF Push Meets Strong Momentum
Key Insights:
Grayscale ETF filing has increased institutional visibility for HYPEUSD, strengthening demand expectations as traditional investors seek simplified exposure to the Hyperliquid ecosystem.
Technical indicators show
CryptoNewsLand3h ago
