
Date: Fri, Dec 26, 2025 | 06:30 PM GMT
The broader cryptocurrency market has been navigating a period of choppy and uncertain price action over the past several weeks, a phase that began after the sharp market-wide sell-off on October 10. During that correction, Ethereum (ETH) dropped nearly 28% over the last 60 days, applying sustained pressure across the altcoin sector — including ether.fi (ETHFI).
ETHFI has mirrored this weakness, sliding more than 31% over the same period. However, despite the sharp downtrend, recent price behavior suggests selling pressure may be easing. The token is now trading near a historically significant demand zone, where buyers have repeatedly stepped in before — raising the possibility that ETHFI could be approaching an inflection point.
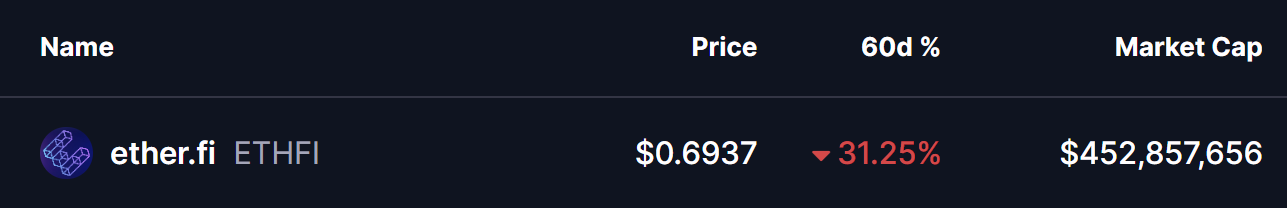
Source: Coinmarketcap
Double Bottom Pattern in Focus
On the daily timeframe, ETHFI appears to be forming a potential double-bottom structure — a classic reversal pattern that often signals exhaustion among sellers. The setup began after ETHFI was rejected from the $0.9233 resistance area, a move that triggered a sharp decline of nearly 28% and pushed price back toward the lower end of its range.
That sell-off dragged ETHFI into the $0.65 support zone, a level that has consistently acted as a strong demand area in the past. The chart now shows price revisiting this same region and stabilizing once again, suggesting buyers are actively defending it. The similarity between the first and second lows strengthens the case that a double-bottom base may be forming.
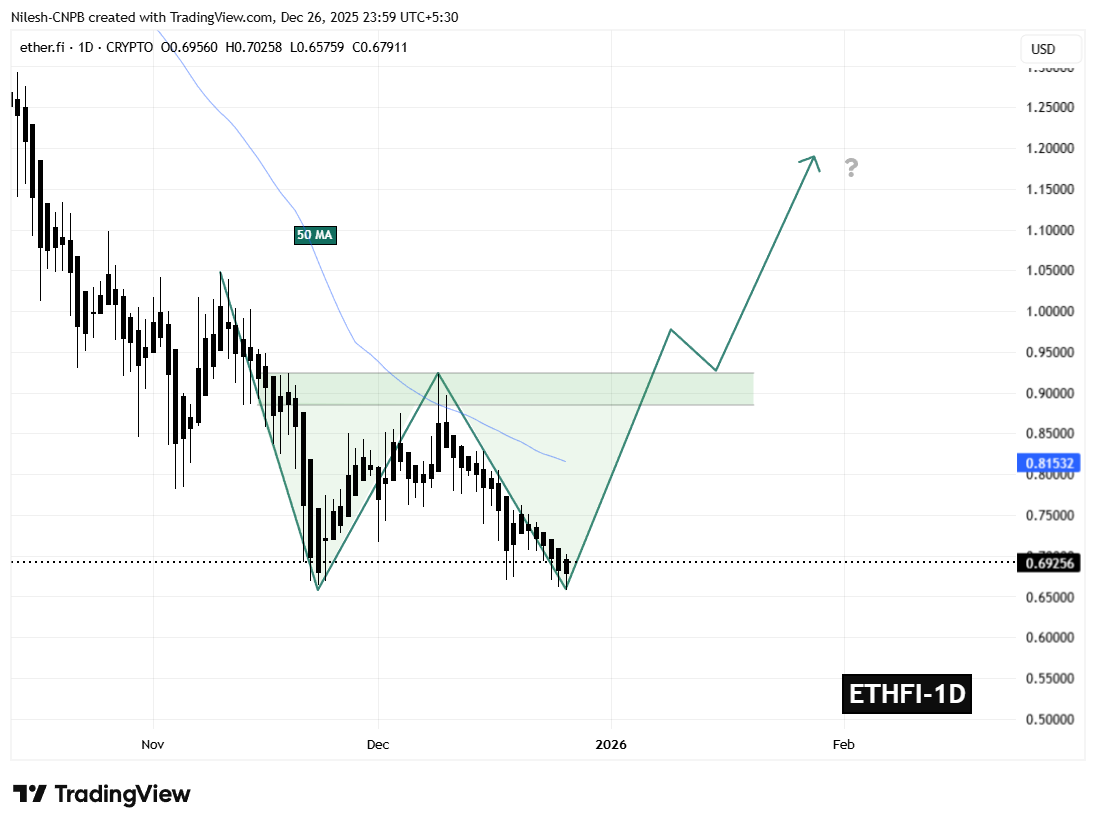
ETHFI Daily Chart/Coinsprobe (Source: Tradingview)
If this support continues to hold, the ongoing consolidation could mark the completion of the second bottom — a critical step in shifting momentum away from sellers and toward a potential trend reversal.
What’s Next for ETHFI?
The $0.65 support zone remains the most important level to monitor in the near term. As long as ETHFI holds above this area, the developing bullish structure remains valid and provides room for momentum to gradually rebuild.
On the upside, the first major challenge sits at the 50-day moving average near $0.8153. This level has repeatedly capped recovery attempts throughout the recent downtrend and now represents the initial test for buyers. A sustained move above this moving average would signal improving market structure and growing bullish confidence.
Beyond that, the $0.9233 neckline stands as the key confirmation level. A decisive breakout above this resistance would complete the double-bottom pattern and significantly strengthen the bullish outlook, potentially opening the door for a broader recovery move in the weeks ahead.
For now, ETHFI finds itself at a technically pivotal zone — one that could either reinforce the existing downtrend or mark the beginning of a meaningful rebound if buyers continue to defend support.
Disclaimer: The views and analysis presented in this article are for informational purposes only and reflect the author’s perspective, not financial advice. Technical patterns and indicators discussed are subject to market volatility and may or may not yield the anticipated results. Investors are advised to exercise caution, conduct independent research, and make decisions aligned with their individual risk tolerance.
Disclaimer: The information on this page may come from third parties and does not represent the views or opinions of Gate. The content displayed on this page is for reference only and does not constitute any financial, investment, or legal advice. Gate does not guarantee the accuracy or completeness of the information and shall not be liable for any losses arising from the use of this information. Virtual asset investments carry high risks and are subject to significant price volatility. You may lose all of your invested principal. Please fully understand the relevant risks and make prudent decisions based on your own financial situation and risk tolerance. For details, please refer to
Disclaimer.
Related Articles
Fed Minutes Keep Bitcoin Traders Guessing as Iran Risk Clouds the Next Four Weeks
The Federal Reserve's recent minutes revealed mixed signals on potential rate changes, influenced by inflation and geopolitical tensions. Bitcoin's price is currently around $71,000, with analysts divided on its future amid these macroeconomic pressures, relying on factors like the Iran ceasefire and inflation trends.
CryptoNewsFlash1h ago
Liquid Capital founder Yihua Yi: Long-term bullish but must respect market cycles; currently focusing on AI transformation
Liquid Capital founder Yi Lihua analyzed the reasons the market is under pressure during an AMA, emphasizing that the long-term outlook remains bullish on ETH, but that the market cycle and volatility must be respected. He pointed out the importance of AI technology for business transformation and shared his successful experience investing in companies after they adopted AI for transformation.
GateNews1h ago
Compass Point cuts Circle to Sell, CRCL shares fall more than 10%
Circle Internet Group(CRCL)stock price fell 9.9%, and Compass Point cut its rating to “Sell,” with a target price of $77, reflecting regulatory risk and the impact of market sentiment. At the same time, a hacking incident involving Drift Protocol triggered a collective lawsuit investigation, indirectly affecting CRCL’s stock price. Market awareness of DeFi risks has increased, and with stablecoin legislation stalled, Circle faces greater structural pressure.
MarketWhisper2h ago
U.S.-Iran ceasefire for 2 weeks! Bitcoin surges past $72,000, with shorts getting forcibly liquidated—liquidations exceeding $400 million.
Middle East conflict turned for the better after the U.S. and Iran agreed to a two-week ceasefire, with market risk sentiment recovering. U.S. stock index futures jumped sharply. Bitcoin broke through the $72,000 high, while oil prices plunged. Although the current rebound is significant, analysts warn that uncertainty around how the ceasefire agreement will be carried out and the overall economic pressure may still limit how long the rally can last.
区块客3h ago
CryptoQuant: Sustainable futures longs are catalyzing BTC and ETH to rise, not liquidation-triggered
CryptoQuant research indicates that after the ceasefire agreement, the price rise in Bitcoin and Ethereum was driven by new longs establishing positions, not by short liquidations. The open interest in BTC and ETH perpetual futures increased by $2.1 billion and $2.2 billion, respectively. Renewed institutional buying in the U.S. brought the Coinbase premium back into positive territory. Bitcoin broke above $69,400, targeting $79,000.
MarketWhisper3h ago
ETH 15-minute pump of 0.60%: exchange net capital outflows and on-chain large transfers drive a short-term rebound
2026-04-10 01:30 to 2026-04-10 01:45 (UTC), ETH traded within the 2185.0 to 2204.03 USDT range. The candlestick return was +0.60%, and the 15-minute intraday swing was 0.87%. During this period, mainstream market attention increased, with trading volume expanding by about 20% compared with the periods before and after, indicating stronger short-term liquidity.
The main drivers behind this unusual move were exchange net outflows and active on-chain large transfers. On-chain data shows that during this period, ETH saw multiple transactions, each over 8,000 ETH,
GateNews3h ago
