Date: Mon, Dec 29, 2025 | 06:36 AM GMT
The broader cryptocurrency market has kicked off the final week of 2025 with modest strength, as Bitcoin (BTC) reclaimed the $90,000 mark while Ethereum (ETH) trades over 3% higher. This improving backdrop has helped stabilize market sentiment, allowing notable altcoins — including Aptos (APT)— to begin forming constructive technical structures.
APT is trading with a modest intraday gain, but more importantly, its daily chart is now signaling a meaningful structural shift — one that could mark the early stages of a bullish continuation if confirmed.
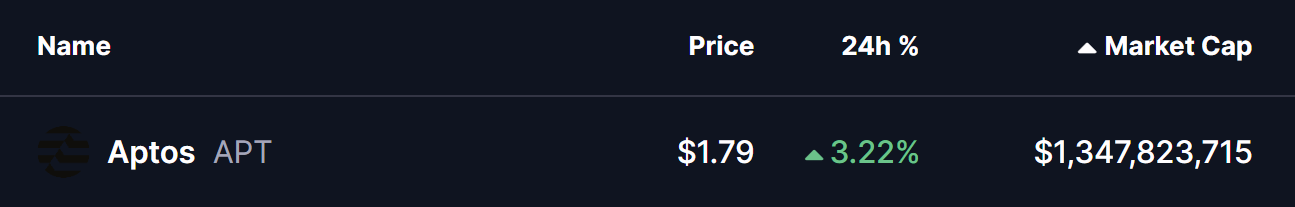
Source: Coinmarketcap
Rounding Bottom in Play
On the daily timeframe, Aptos appears to be shaping a textbook rounding bottom formation — a classic bullish reversal pattern that typically emerges after an extended period of downside pressure. This structure reflects a gradual transition from distribution to accumulation, where sellers lose control and buyers quietly begin to step in.
APT previously faced strong rejection near the $3.08 neckline zone before entering a sharp decline that eventually bottomed out near $1.42. This area acted as a critical demand zone, where price repeatedly found support, preventing any deeper breakdown and laying the groundwork for a potential trend reversal.
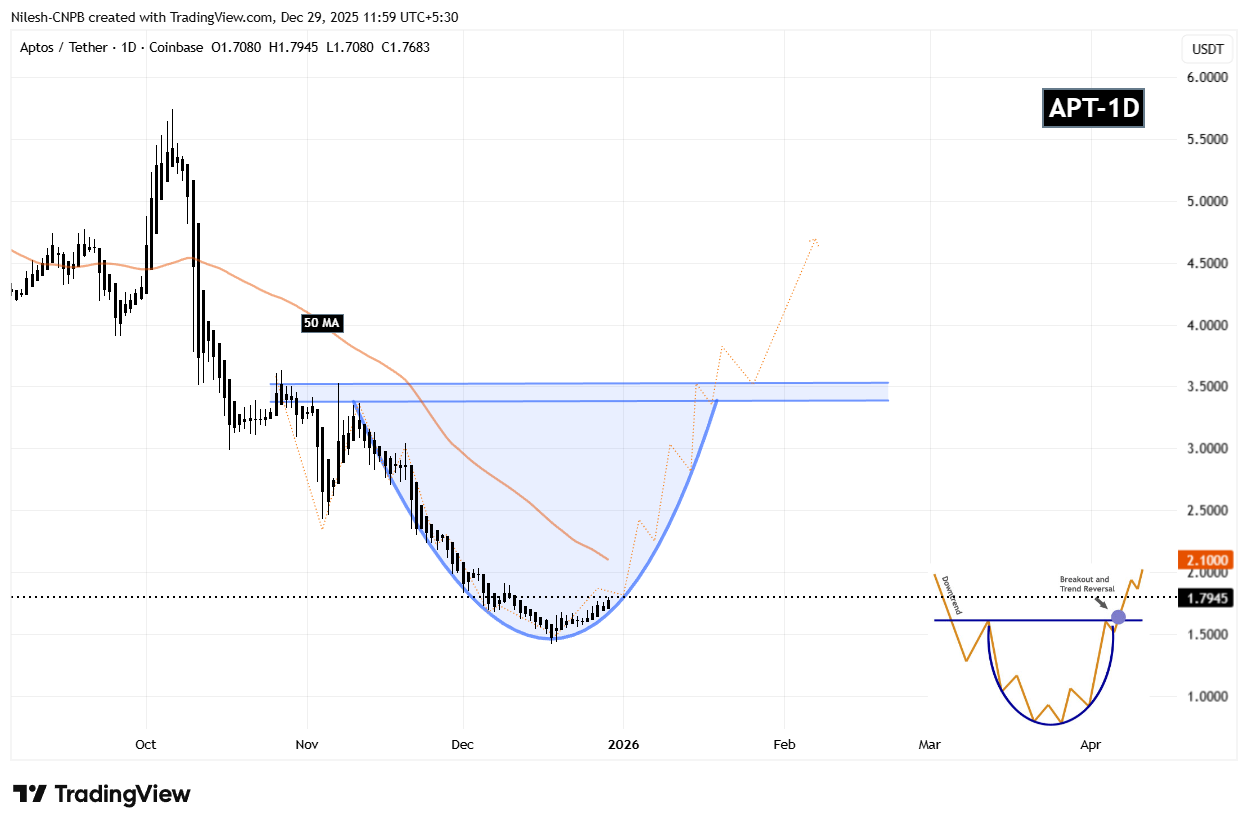
Aptos (APT) Daily Chart/Coinsprobe (Source: Tradingview)
Since establishing that base, APT has begun curving higher in a rounded fashion, signaling that selling pressure is fading. The steady recovery back toward the $1.79 region suggests that accumulation is underway and that the market is slowly preparing for a larger move.
What’s Next for APT?
For the rounding bottom pattern to fully activate, APT must reclaim the 50-day moving average, currently positioned near $2.10. A decisive move above this level would mark a key momentum shift, confirming that buyers are regaining control after months of corrective price action.
Beyond that, the major technical hurdle remains the neckline resistance around $3.08. A clean breakout above this zone would validate the entire reversal structure and could open the door for a broader bullish expansion phase, with momentum traders likely re-entering the market.
Until those levels are reclaimed, the pattern remains in development. Short-term pullbacks or consolidation are still possible if APT struggles at the 50-day MA, but as long as price continues to hold higher lows above the $1.42 base, the broader bottoming structure remains intact.
Overall, Aptos is approaching a technically important inflection point. The rounding bottom formation, improving structure, and proximity to key resistance levels suggest the coming sessions could prove decisive for the token’s next directional move.
Disclaimer
The views and analysis presented in this article are for informational purposes only and reflect the author’s perspective, not financial advice. Technical patterns and indicators discussed are subject to market volatility and may or may not yield the anticipated results. Investors are advised to exercise caution, conduct independent research, and make decisions aligned with their individual risk tolerance.
About Author
Nilesh Hembade is the Founder and Lead Author of Coinsprobe, with over 5 years of experience in the cryptocurrency and blockchain industry. Since launching Coinsprobe in 2023, he has been providing daily, research-driven insights through in-depth market analysis, on-chain data, and technical research.

Disclaimer: The information on this page may come from third parties and does not represent the views or opinions of Gate. The content displayed on this page is for reference only and does not constitute any financial, investment, or legal advice. Gate does not guarantee the accuracy or completeness of the information and shall not be liable for any losses arising from the use of this information. Virtual asset investments carry high risks and are subject to significant price volatility. You may lose all of your invested principal. Please fully understand the relevant risks and make prudent decisions based on your own financial situation and risk tolerance. For details, please refer to
Disclaimer.
Related Articles
BTC 15-minute surge of 1.07%: On-chain activity spikes and ETF fund inflows synchronize to drive the move
2026-04-07 22:45 to 2026-04-07 23:00 (UTC), the BTC price recorded a +1.07% return. The price range was 70,733.5 to 71,518.9 USDT, with a 1.11% amplitude. Short-term volatility intensified, drawing strong market attention. On-chain data shows the number of active addresses rose to 38,971, up 5.2% from the previous hour. The total number of addresses added approximately 252,780 within an hour; network activity and new user growth increased significantly, becoming the incremental market momentum behind the unusual move. Spot trading volume reached 11
GateNews31m ago
ETH 15-minute increase of 0.64%: Short-term capital inflows and sentiment shifts drive price fluctuations
2026-04-07 22:00 to 22:15 (UTC), the ETH price ranged between 2145.02 and 2165.83 USDT, and the 15-minute candlestick return reached +0.64%, with a trading range (amplitude) of 0.97%. Market volatility increased and attention rose, indicating short-term activity driven by rapid capital flows.
The main driving force behind this unusual move is that, in the short term, some funds flowed into ETH. Investors are focusing on ETH mainnet assets, and buying interest increased, pushing spot prices higher. At the same time, DeFi and stablecoin-related trading remained active, boosting on-chain liquidity and helping to support a
GateNews1h ago
BTC 15-minute jump of 0.52%: institutional capital inflows and derivatives leverage driving market upside
2026-04-07 22:00 to 2026-04-07 22:15 (UTC), BTC recorded a 15-minute K-line return of +0.52%, with a trading range of 69,919.3 to 70,561.1 USDT and a swing of 0.92%. This bout of abnormal movement occurred against the backdrop of BTC breaking through the $70,000 level, rising market attention, and heightened short-term volatility.
The main driving force behind this abnormal move was the inflow of large-scale institutional funds and a synchronized buy-side response tied to ETFs. Among them, an ETF product under a global asset management giant transferred 1,1
GateNews1h ago
XRP Stabilizes Near Key Levels Amid Fed Pressure and Rule Shift
Key Insights
XRP stabilized near $1.31 as macroeconomic pressures and declining liquidity combined to limit recovery momentum and increase short-term volatility risks significantly.
Proposed stablecoin regulations favor utility models, positioning RLUSD for growth while reducing incentives t
CryptoNewsLand2h ago
BTC 15-minute up 0.98%: Whale transfers surge in tandem with geopolitical hedging demand
2026-04-07 21:00 to 21:15 (UTC), the BTC price saw a clear spike. The candlestick return rate recorded +0.98%, and the price range was 69309.9-70214.9 USDT, with a 1.31% amplitude. Short-term market volatility increased, participation interest rose, and trading volume and the number of active entities increased in parallel.
The main driver behind this move was whale trading activity. On-chain data shows that the transfer volume to exchanges by whale entities holding more than 1,000 BTC surged before and after the event window. Over the past 24 hours, whale inflow reached 10,5
GateNews2h ago
GLMR Rockets 19.44% as Altcoin Rally Gains Momentum
Moonbeam (GLMR) surged 19.44% to $0.0129 amid increased trader interest, driven by broader cryptocurrency trends and market participation. Analysts note potential for continued growth as resistance levels are closely monitored.
Coinfomania2h ago
