
The broader cryptocurrency market is showing modest strength, with both Bitcoin (BTC) and Ethereum (ETH) trading in the green. This stability among the majors has helped support sentiment across the altcoin space, and Curve DAO Token (CRV) is now beginning to flash early signs of a potential momentum shift.
CRV has managed to post around 3% gains, and more importantly, its daily chart is revealing a high-probability bullish setup that could hint at a much larger move ahead if momentum continues to build.
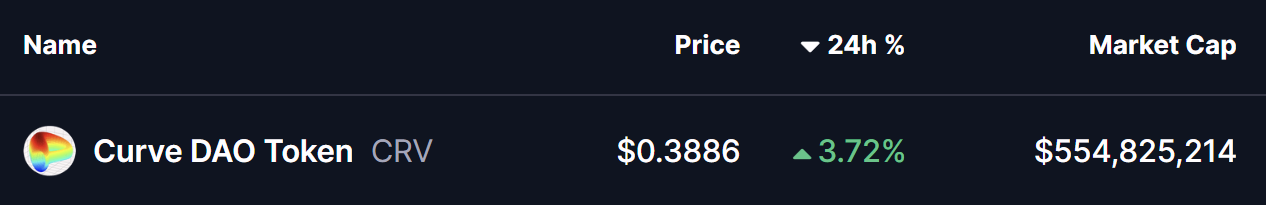
Source: Coinmarketcap
Power of 3 Pattern Takes Shape
On the daily timeframe, CRV appears to be forming a classic Power of 3 (PO3) pattern — a structure commonly associated with smart money behavior. This pattern typically unfolds in three stages: accumulation, manipulation, and expansion, often preceding a strong directional breakout.
Accumulation Phase Defined
During the accumulation phase, CRV spent several sessions trading sideways between $0.4314 resistance and $0.3773 support. This tight consolidation reflected equilibrium between buyers and sellers, allowing larger participants to build positions quietly while volatility remained compressed.
The flat price action within this range laid the foundation for the next phase, as liquidity gradually built up above and below the range boundaries.
Manipulation Flush Clears Weak Hands
CRV recently entered the manipulation phase when price briefly broke below the $0.3773 support, dropping sharply to a local low near $0.3321. This sudden downside move aligns with the typical stop-hunt behavior seen in Power of 3 setups, designed to shake out weak hands and trigger sell-side liquidity before a reversal.
Notably, the breakdown was short-lived, and sellers failed to maintain control — an early sign that downside momentum may be exhausting.
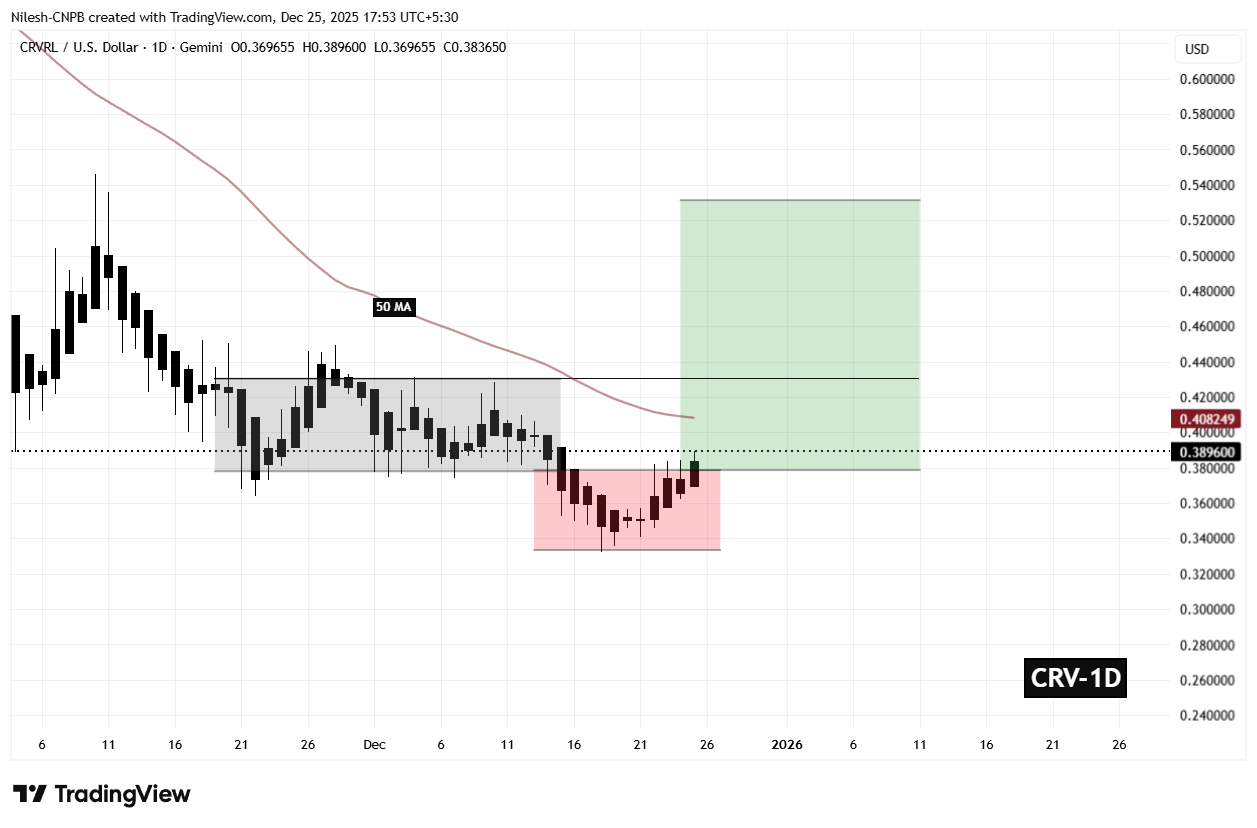
Curve DAO Token (CRV) Daily Chart/Coinsprobe (Source: Tradingview)
Expansion Phase Begins to Unfold
Following the sweep of lows, CRV rebounded decisively back above the $0.3773 level, reclaiming it as support. This recovery suggests that the expansion phase may now be underway, with buyers stepping back in and defending key structure levels.
Price is currently pushing higher toward the 50-day moving average near $0.4082, which has acted as dynamic resistance during the broader downtrend. A daily close above this level would mark an important technical shift and strengthen the bullish reversal narrative.
What’s Next for CRV?
If CRV manages to break and hold above the 50-day MA, the next key target sits at $0.4314, the upper boundary of the prior accumulation range. Reclaiming this zone with conviction would confirm a bullish breakout and likely attract fresh momentum buyers.
Based on the Power of 3 structure, a successful breakout could open the door toward the $0.52–$0.54 region, derived by projecting the height of the accumulation range from the breakout point — aligning closely with the upside zone highlighted on the chart.
However, caution remains warranted. A failure to hold above $0.3773 could invalidate the expansion phase and force CRV back into consolidation, delaying any meaningful upside continuation.
For now, CRV sits at a technically critical juncture, with price action suggesting that smart money positioning may already be underway ahead of a potential expansion move.
Disclaimer: The views and analysis presented in this article are for informational purposes only and reflect the author’s perspective, not financial advice. Technical patterns and indicators discussed are subject to market volatility and may or may not yield the anticipated results. Investors are advised to exercise caution, conduct independent research, and make decisions aligned with their individual risk tolerance.
Disclaimer: The information on this page may come from third parties and does not represent the views or opinions of Gate. The content displayed on this page is for reference only and does not constitute any financial, investment, or legal advice. Gate does not guarantee the accuracy or completeness of the information and shall not be liable for any losses arising from the use of this information. Virtual asset investments carry high risks and are subject to significant price volatility. You may lose all of your invested principal. Please fully understand the relevant risks and make prudent decisions based on your own financial situation and risk tolerance. For details, please refer to
Disclaimer.
Related Articles
The Crypto Fear and Greed Index rose to 17 today, and the market remains in a state of extreme fear
Gate News message: On April 8, according to Alternative.me data, the crypto Fear and Greed Index rose to 17 today, up from 11 yesterday (April 7), but the market overall is still in a state of “extreme fear.”
GateNews2m ago
Bitcoin reclaims $72K after US, Iran agree to 2-week ceasefire
Bitcoin surged past $72,000 after a two-week ceasefire between the US and Iran was announced. Traders often react positively to eased geopolitical tensions, despite overall market fear.
Cointelegraph2m ago
BTC drops 1.03% in 15 minutes: tighter macro liquidity and derivatives synchronized to amplify sell-off pressure
From 23:30 to 23:45 (UTC) on 2026-04-07, the BTC price rapidly fell within 15 minutes, with a return of -1.03%. The price range was 71,905.7 to 72,760.5 USDT, and the amplitude was 1.17%. Market attention remained high; intraday volatility significantly increased. Trading volumes across major platforms briefly surged, indicating that selling pressure and risk-avoidance sentiment had permeated mainstream cryptocurrencies.
The main drivers of this deviation were the continued tightening of macro liquidity under the Fed’s hawkish signals and a concentrated adjustment in the BTC derivatives market. The Fed’s interest rate in March 2026
GateNews56m ago
Peter Schiff Challenges Michael Saylor as Bitcoin Debate Heats Up
Peter Schiff and Michael Saylor recently debated Bitcoin's performance, with Schiff arguing it underperformed gold and equities over five years, while Saylor highlighted shorter-term gains. Their dispute illustrates the complexity of data selection in assessing investment viability.
CryptoFrontNews1h ago
BTC 15-minute surge of 1.07%: On-chain activity spikes and ETF fund inflows synchronize to drive the move
2026-04-07 22:45 to 2026-04-07 23:00 (UTC), the BTC price recorded a +1.07% return. The price range was 70,733.5 to 71,518.9 USDT, with a 1.11% amplitude. Short-term volatility intensified, drawing strong market attention. On-chain data shows the number of active addresses rose to 38,971, up 5.2% from the previous hour. The total number of addresses added approximately 252,780 within an hour; network activity and new user growth increased significantly, becoming the incremental market momentum behind the unusual move. Spot trading volume reached 11
GateNews1h ago
ETH 15-minute increase of 0.64%: Short-term capital inflows and sentiment shifts drive price fluctuations
2026-04-07 22:00 to 22:15 (UTC), the ETH price ranged between 2145.02 and 2165.83 USDT, and the 15-minute candlestick return reached +0.64%, with a trading range (amplitude) of 0.97%. Market volatility increased and attention rose, indicating short-term activity driven by rapid capital flows.
The main driving force behind this unusual move is that, in the short term, some funds flowed into ETH. Investors are focusing on ETH mainnet assets, and buying interest increased, pushing spot prices higher. At the same time, DeFi and stablecoin-related trading remained active, boosting on-chain liquidity and helping to support a
GateNews2h ago
