Date: Mon, Dec 29, 2025 | 06:36 AM GMT
The broader cryptocurrency market has kicked off the final week of 2025 with modest strength, as Bitcoin (BTC) reclaimed the $90,000 mark while Ethereum (ETH) trades over 3% higher. This improving backdrop has helped stabilize market sentiment, allowing notable altcoins — including Aptos (APT)— to begin forming constructive technical structures.
APT is trading with a modest intraday gain, but more importantly, its daily chart is now signaling a meaningful structural shift — one that could mark the early stages of a bullish continuation if confirmed.

Source: Coinmarketcap
Rounding Bottom in Play
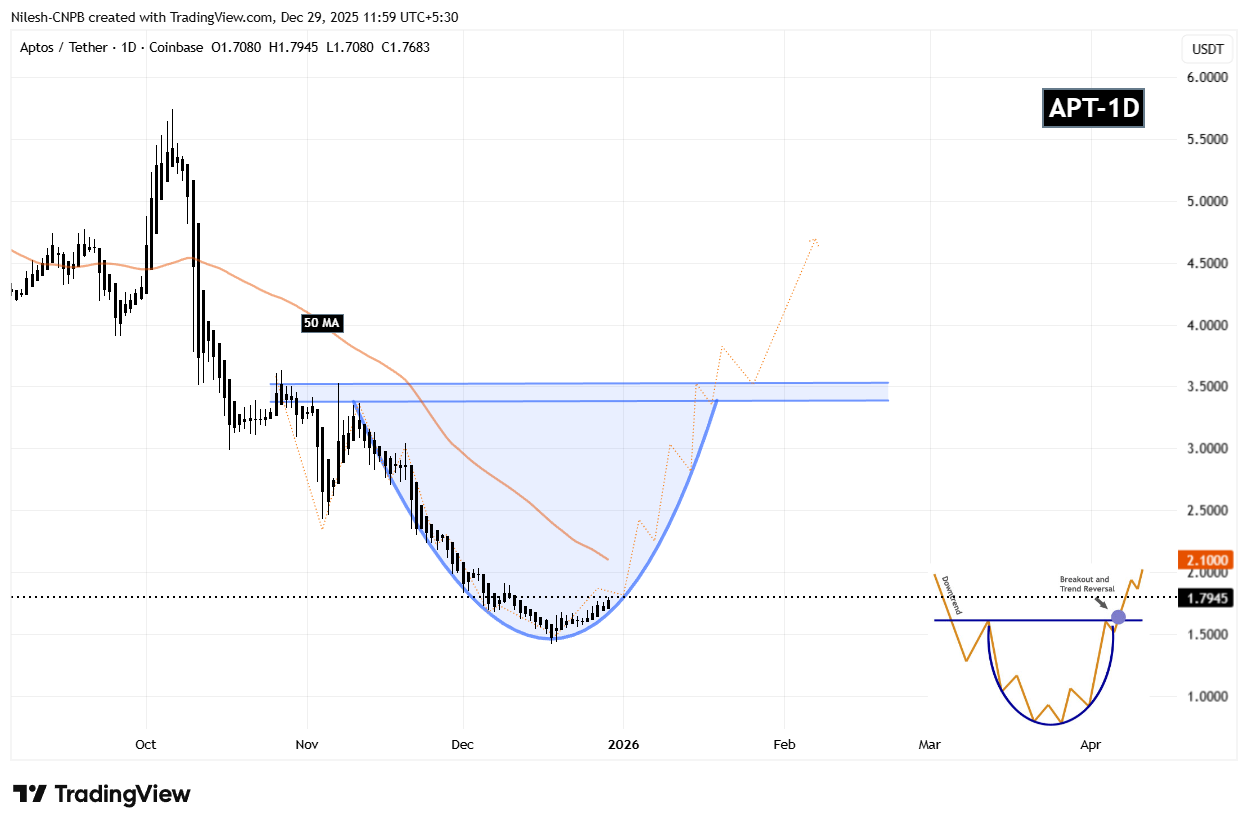
On the daily timeframe, Aptos appears to be shaping a textbook rounding bottom formation — a classic bullish reversal pattern that typically emerges after an extended period of downside pressure. This structure reflects a gradual transition from distribution to accumulation, where sellers lose control and buyers quietly begin to step in.
APT previously faced strong rejection near the $3.08 neckline zone before entering a sharp decline that eventually bottomed out near $1.42. This area acted as a critical demand zone, where price repeatedly found support, preventing any deeper breakdown and laying the groundwork for a potential trend reversal.
Aptos (APT) Daily Chart/Coinsprobe (Source: Tradingview)
Since establishing that base, APT has begun curving higher in a rounded fashion, signaling that selling pressure is fading. The steady recovery back toward the $1.79 region suggests that accumulation is underway and that the market is slowly preparing for a larger move.
What’s Next for APT?
For the rounding bottom pattern to fully activate, APT must reclaim the 50-day moving average, currently positioned near $2.10. A decisive move above this level would mark a key momentum shift, confirming that buyers are regaining control after months of corrective price action.
Beyond that, the major technical hurdle remains the neckline resistance around $3.08. A clean breakout above this zone would validate the entire reversal structure and could open the door for a broader bullish expansion phase, with momentum traders likely re-entering the market.
Until those levels are reclaimed, the pattern remains in development. Short-term pullbacks or consolidation are still possible if APT struggles at the 50-day MA, but as long as price continues to hold higher lows above the $1.42 base, the broader bottoming structure remains intact.
Overall, Aptos is approaching a technically important inflection point. The rounding bottom formation, improving structure, and proximity to key resistance levels suggest the coming sessions could prove decisive for the token’s next directional move.
Disclaimer
The views and analysis presented in this article are for informational purposes only and reflect the author’s perspective, not financial advice. Technical patterns and indicators discussed are subject to market volatility and may or may not yield the anticipated results. Investors are advised to exercise caution, conduct independent research, and make decisions aligned with their individual risk tolerance.
About Author
Nilesh Hembade is the Founder and Lead Author of Coinsprobe, with over 5 years of experience in the cryptocurrency and blockchain industry. Since launching Coinsprobe in 2023, he has been providing daily, research-driven insights through in-depth market analysis, on-chain data, and technical research.

Disclaimer: The information on this page may come from third parties and does not represent the views or opinions of Gate. The content displayed on this page is for reference only and does not constitute any financial, investment, or legal advice. Gate does not guarantee the accuracy or completeness of the information and shall not be liable for any losses arising from the use of this information. Virtual asset investments carry high risks and are subject to significant price volatility. You may lose all of your invested principal. Please fully understand the relevant risks and make prudent decisions based on your own financial situation and risk tolerance. For details, please refer to
Disclaimer.
Related Articles
The MVRV of short-term Bitcoin holders has dropped to 0.77, with an average unrealized loss of nearly 30%.
The current price of Bitcoin is in the range of $65,000 to $70,000, which is significantly different from the average cost of short-term holders at $85,900, leading most investors to incur losses. The MVRV metric has dropped to 0.77, indicating that the short-term holding group is under pressure.
GateNews4m ago
Why Is Bitcoin Down Today? The U.S. Extends the Iran War, ETF Outflows Accelerate as Miners Surrender
Bitcoin has fallen below $67,000, with a weekly decline of about 3%, influenced by U.S. military actions against Iran, along with outflows from spot Bitcoin ETFs and the return of interest rate hike expectations in pricing, leading to a fearful market sentiment. Increased miner sell-offs have been noted, but it is pointed out that demand-side expansion confirmation is needed to maintain a bullish outlook.
MarketWhisper33m ago
Cardano Price at Risk: Will ADA Lose Its Multi-Year Support? What Comes Next - BTC Hunts
Cardano's price is nearing a critical support level at $0.237, following a rejection at $0.275 amidst broader market weakness. With consistent lower lows and capital outflows, bearish sentiment persists, risking further declines if support fails. Resistance is seen at $0.27.
BTCHUNTS1h ago
Is the XRP Bottom Finally Here? 3 Massive Bullish Signals You Need to See
Although in a more modest manner, XRP whales have returned to the scene, amassing more tokens over the past week, which is categorized as the first bullish sign for the underlying asset.
Another could come in the form of the technical tool used to determine whether that asset’s move in either
CryptoPotato2h ago
Bitcoin’s Most Dangerous Pattern Just Triggered: Will BTC Dump to $26K Next?
Although bitcoin has already dumped by over 50% from its all-time high of over $126,000 marked in October to a multi-year low of $60,000, the asset’s troubles might not be over, warned Merlijn The Trader.
The popular analyst indicated that the “most dangerous bitcoin pattern just completed phase
CryptoPotato2h ago
Ethereum (ETH) on the Edge: Critical Level Stands Between New Bull Run and a Major Crash
While the second-largest cryptocurrency has registered a significant rebound over the past month, it remains at risk of plummeting to drastically low levels during this cycle.
On the other hand, some important indicators suggest that the worst might be over and the price could be gearing up for a m
CryptoPotato3h ago
