Tron (TRX) is recorded trading above the $0.2800 USD threshold at the time of writing on Monday, maintaining a sideways movement just below the 50-day exponential moving average (EMA), which currently stands at $0.2859 USD. Notably, Justin Sun – the founder of Tron – announced a $18 million equity investment in Tron Inc., a company listed on the Nasdaq (formerly SRM Entertainment, Inc.), with the goal of further strengthening and expanding the company’s TRX reserves. On the technical side, momentum indicators are signaling positive trends and gradually leaning towards an upward trend. However, in the short term, TRX may face resistance at key overhead levels.
Justin Sun makes a strategic equity investment of $18 million
On Monday, Tron Inc. received an $18 million equity investment from Justin Sun through Black Anthem Limited, aimed at boosting the strategy to expand TRX reserve holdings. The transaction was executed at a price of $1.3775 per share.
As of Tuesday, Tron Inc. holds over 677 million TRX tokens, accounting for approximately 0.716% of the total circulating supply, with an estimated value exceeding $193 million — reaffirming the company’s growing position within the TRON ecosystem.
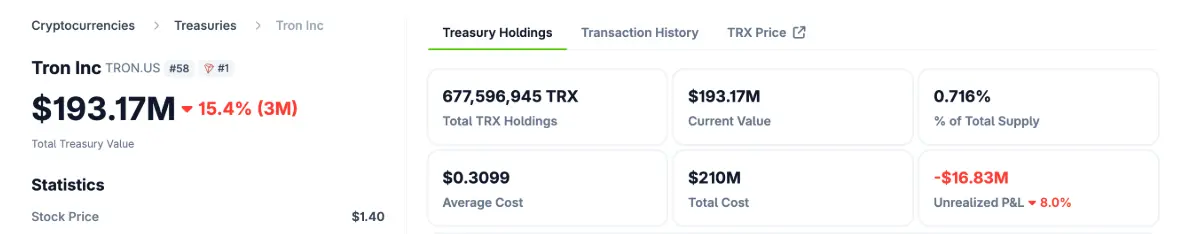 The amount of TRX held by Tron Inc. | Source: CoinGeckoSharing his long-term strategy, Mr. Rich Miller, CEO of Tron Inc., emphasized: “We are proactively positioning Tron Inc. to capitalize on the increasing adoption of the TRON network, blockchain-based global payment solutions, and Web3 infrastructure. The new capital not only strengthens our balance sheet but also expands our digital asset reserves, laying a solid foundation for sustainable value growth for shareholders in the long run.”
Tron’s recovery trend faces a crossroads at the 50-day EMA
The price of Tron (TRX) has established a solid support zone around $0.2764 USD — the low recorded on November 4 — during Thursday’s trading session, before rebounding nearly 2% on Saturday. However, this recovery still encounters significant resistance as it approaches the 50-day exponential moving average (EMA) at $0.2859 USD. Selling pressure around this level is reflected in a series of Doji candles with long wicks, indicating strong indecision between bulls and bears.
Nevertheless, the appearance of long-bodied candles suggests underlying buying interest is quietly accumulating, increasing the likelihood that TRX could break above the 50-day EMA in the coming sessions. A clear close above $0.2859 USD would open up room for further recovery, targeting the 200-day EMA at $0.2944 USD.
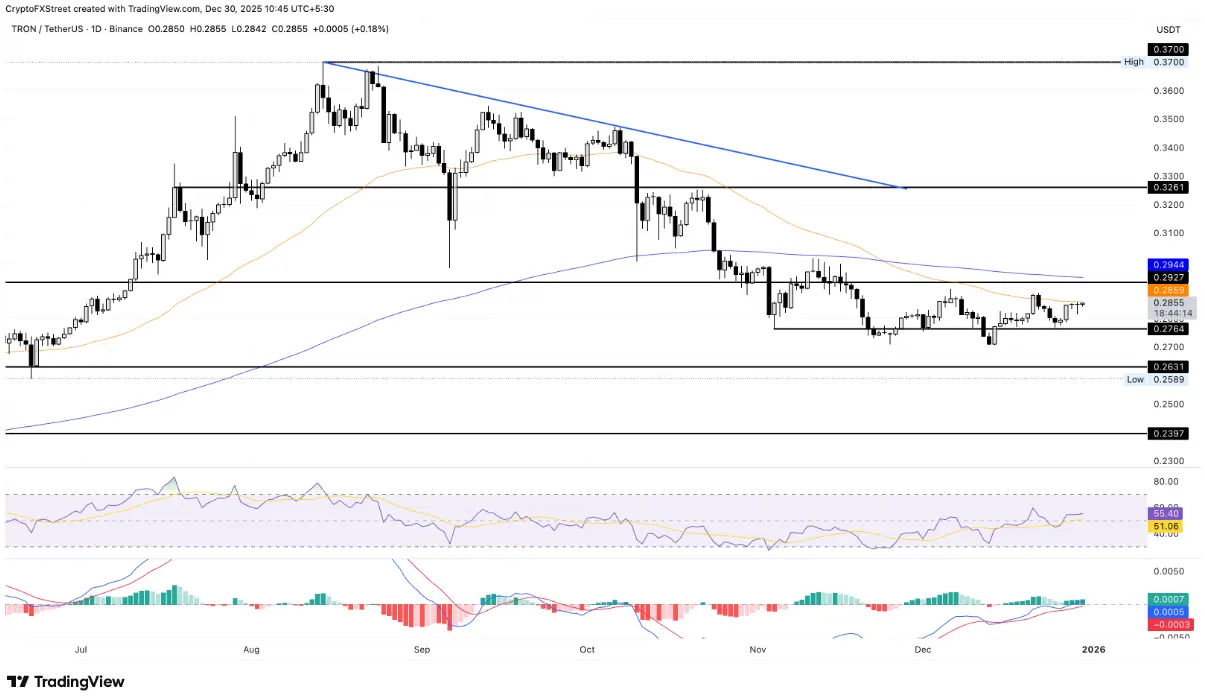 Daily TRX/USDT chart | Source: TradingViewRegarding indicators, the Relative Strength Index (RSI) on the daily timeframe remains around the 55 level and stays above the neutral line, indicating buying momentum has not weakened despite short-term fluctuations. Meanwhile, the MACD line has crossed above zero, with the signal line continuing to trend upward, further supporting a positive outlook for TRX’s short-term trend.
Conversely, if the price reverses downward and loses the support level of $0.2764 USD, the short-term recovery outlook will be invalidated, and there is a risk that TRX could retreat to the May 31 low at $0.2631 USD.
Disclaimer: The information on this page may come from third parties and does not represent the views or opinions of Gate. The content displayed on this page is for reference only and does not constitute any financial, investment, or legal advice. Gate does not guarantee the accuracy or completeness of the information and shall not be liable for any losses arising from the use of this information. Virtual asset investments carry high risks and are subject to significant price volatility. You may lose all of your invested principal. Please fully understand the relevant risks and make prudent decisions based on your own financial situation and risk tolerance. For details, please refer to
Disclaimer.
Related Articles
Michael Saylor: Bitcoin may have already hit bottom, but quantum risks have been exaggerated
Strategy Executive Chairman Michael Saylor believes Bitcoin hit its bottom around $60,000 this February, because all forced sellers in the market have already exited. He said that the catalyst for the next bull market will be a bitcoin-based banking credit system, while he believes the threat from quantum computing is being exaggerated, and he pointed out that the technical community has enough time to deal with this threat.
MarketWhisper44m ago
Glassnode: Is the Bitcoin rebound just a dead cat bounce? Where is the key pressure level?
Glassnode reports that although the Bitcoin price rebounded to $72k due to a U.S.-Iran ceasefire, the market structure is still in a bear market. In the short term, the downside may be limited, but the $78k level faces pressure overhead. ETF capital inflows have ticked up slightly, but they have not yet fully returned; trading activity in derivatives remains sluggish, indicating insufficient market confidence. Going forward, we need to monitor changes in the futures trading and options markets.
ChainNewsAbmedia1h ago
Why is Bitcoin down today? The Iran–Israel ceasefire is on the verge of collapse, and the Strait of Hormuz shuts down again
Bitcoin has recently been trading below $72,000 and faces risks from the failure of the U.S.-Iran ceasefire talks and the Strait of Hormuz closing again, which has weighed on market sentiment. At the same time, Federal Reserve meeting minutes show that the likelihood of further rate hikes is rising, further affecting the valuation of risk assets. Bitcoin’s key resistance level is $75,000 and its support level is $68,000; the market is currently waiting for a clear direction confirmation signal.
MarketWhisper1h ago
The Crypto Fear and Greed Index drops to 14, and the market remains in extreme fear
Gate News message, April 9, according to Alternative data, today’s Crypto Fear and Greed Index is 14 (yesterday was 17), and the market remains in extreme fear. The index ranges from 0-100 and provides a composite assessment of six indicators: volatility (25%), market trading volume (25%), social media buzz (15%), market surveys (15%), Bitcoin’s share of the entire market (10%), and Google trending topic analysis (10%).
GateNews2h ago
Optimism over the Iran-U.S. ceasefire helped drive a broad rebound in U.S. stocks, and Bitcoin rose to a three-week high.
The United States and Iran reached a two-week ceasefire agreement, and global financial markets turned optimistic, with the S&P 500 rising 2.51%. U.S. crude oil prices fell to below $95 per barrel, easing concerns about an energy crisis. Bitcoin at one point rose 5% to $72,841, hitting a three-week high. Expectations that the Federal Reserve will cut interest rates have also increased.
ChainNewsAbmedia2h ago
Bitcoin ETF attracts $470 million, setting a 6-week high! Analyst: “A breakout rally is brewing.”
U.S. spot Bitcoin ETF inflows hit a new six-week high on Monday, signaling a rebound in institutional investor confidence. Total net inflows of $471.3 million came mainly from institutions such as BlackRock and Fidelity. Even though market sentiment is gradually improving, broader macroeconomic and geopolitical risks could still affect Bitcoin’s upward momentum. Analysts said that sustained structural buying can support Bitcoin, but future price action will still need to be monitored for changes in external factors.
区块客2h ago
